
-
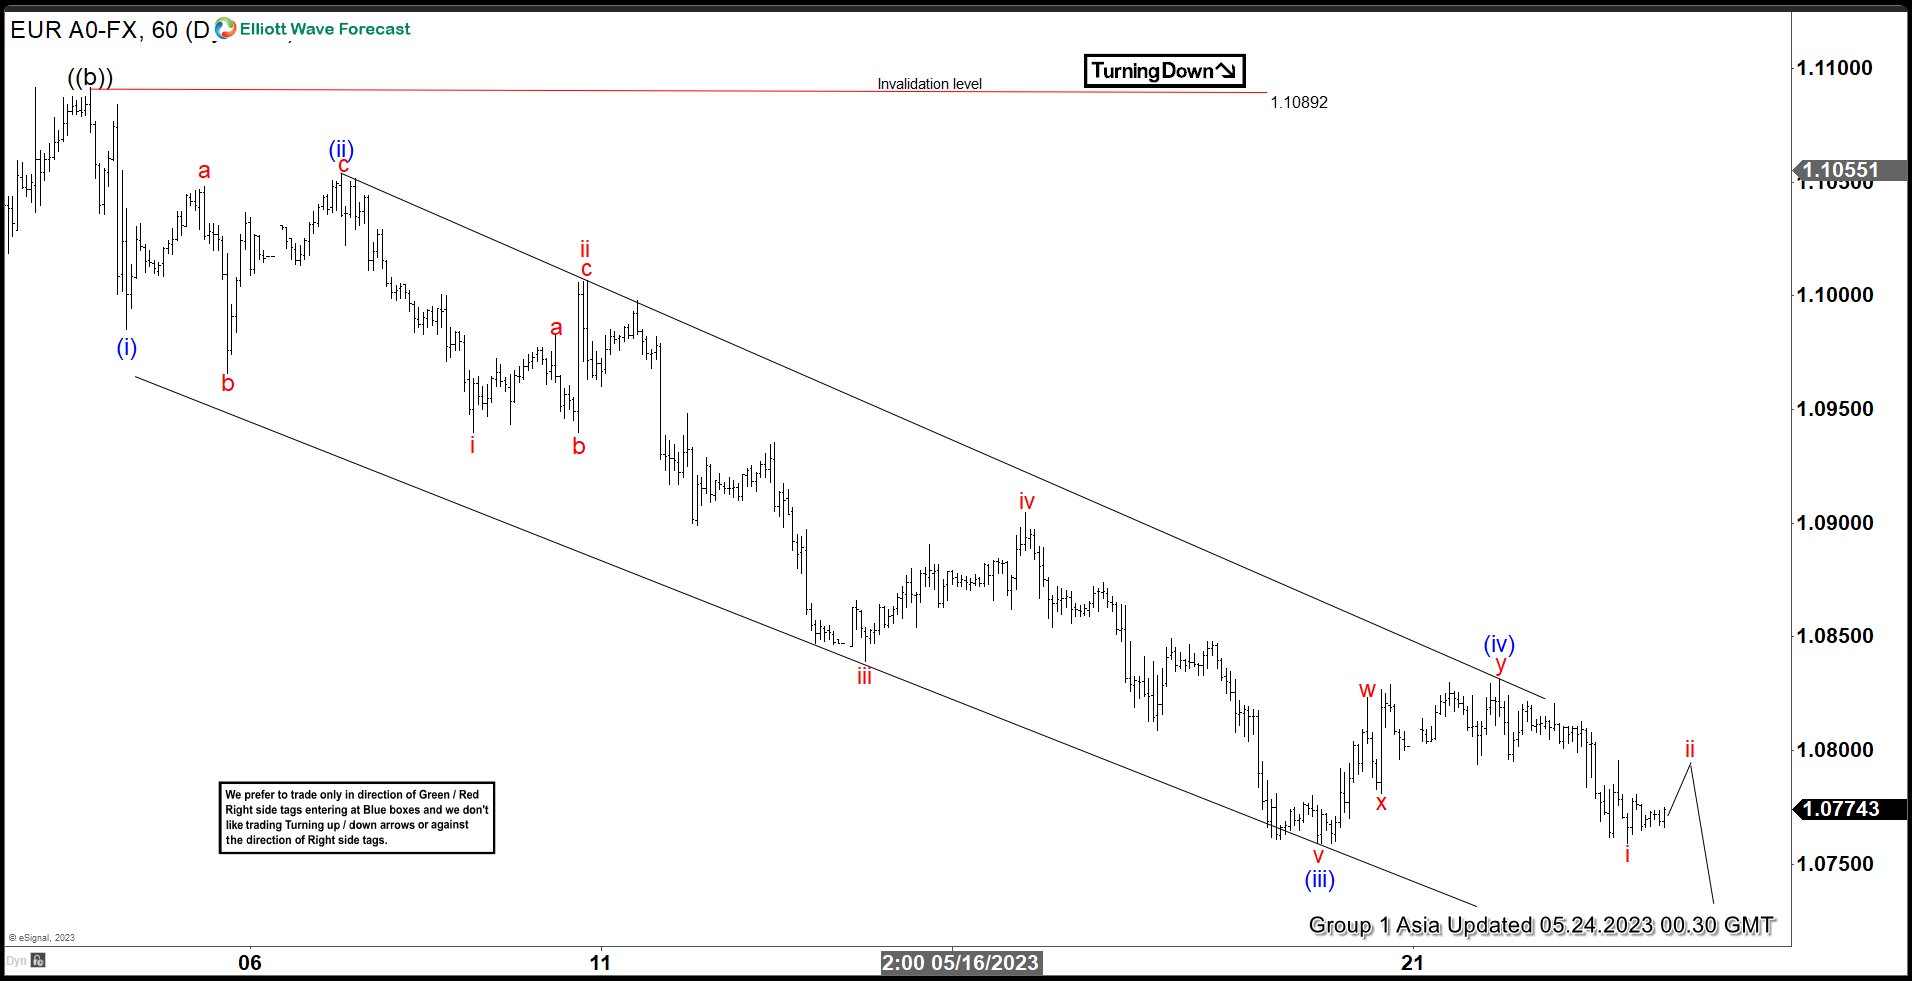
EURUSD Close to Ending Elliott Wave Impulse Decline
Read MoreEURUSD is close to ending cycle from 5.4.2023 high as an impulse. Pair soon can see at least 3 waves rally. This article & video shows the path.
-
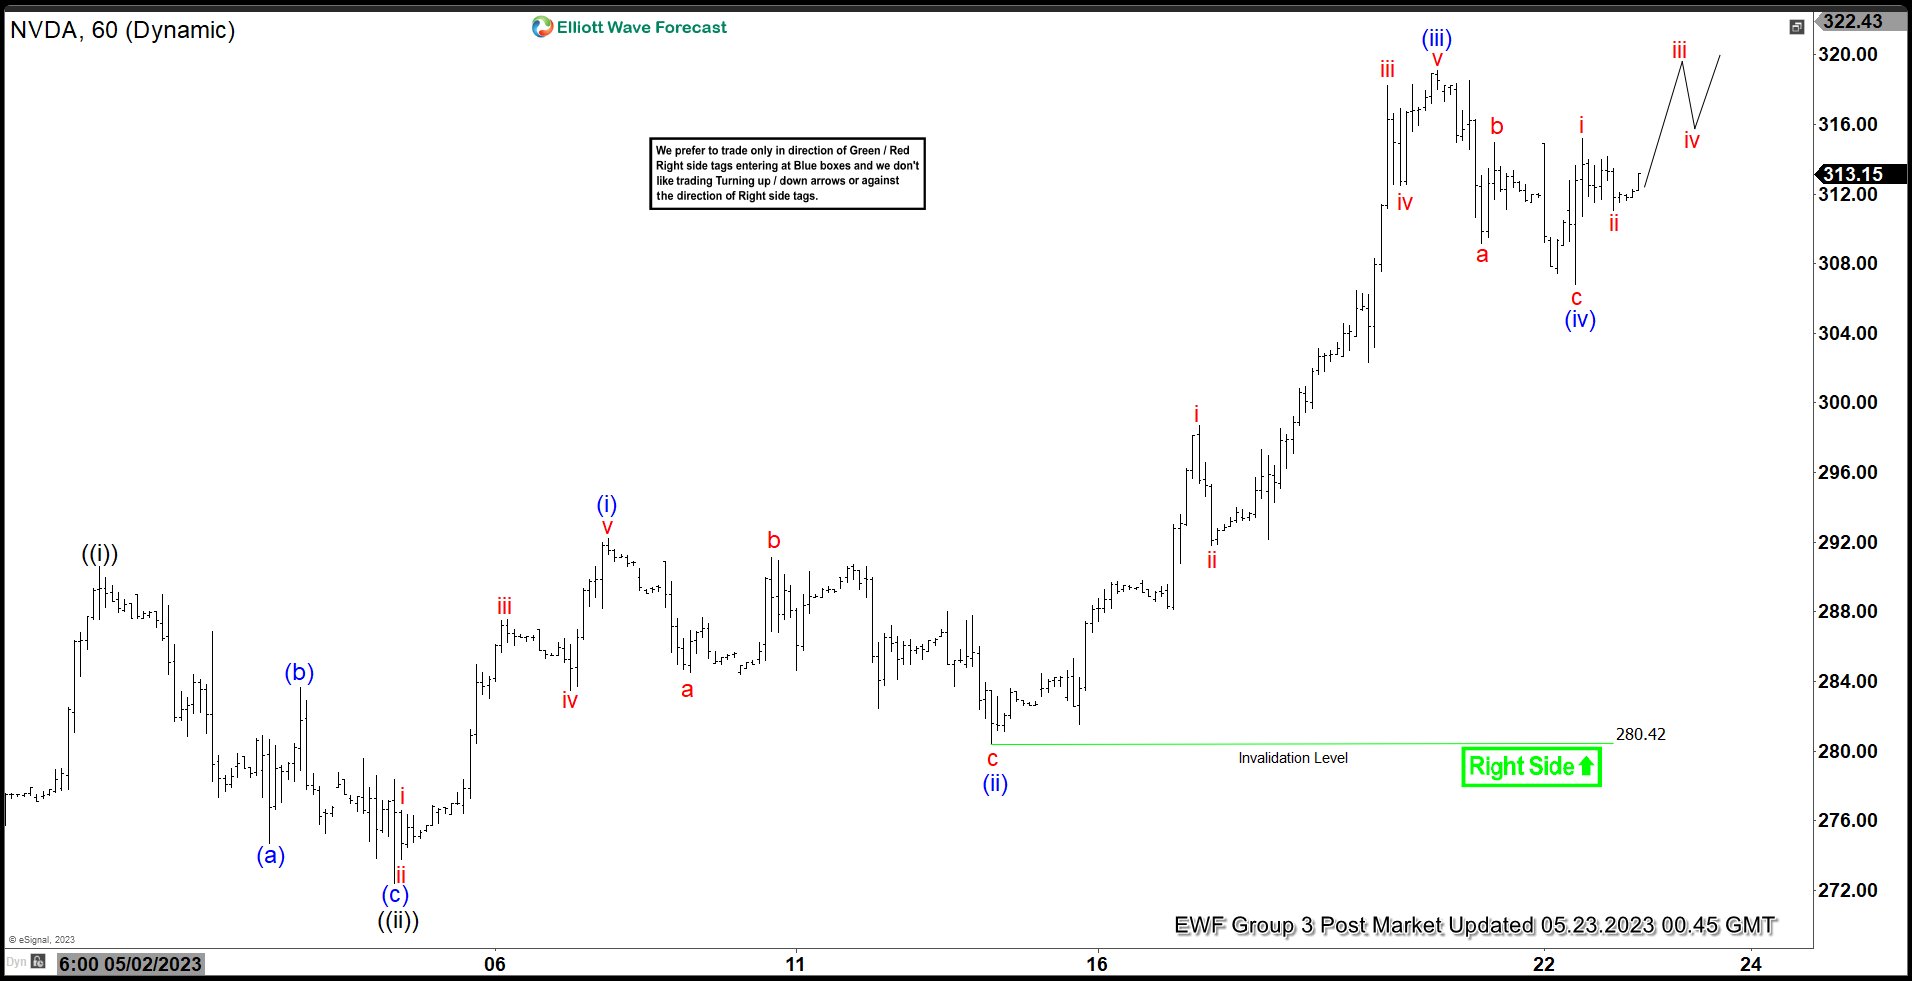
Elliott Wave View: NVDA Bullish Momentum Looking for More Upside
Read MoreNvidia Corporation (NVDA) rally from 4.26.2023 low as an impulse looking for more upside. This article & video look at the Elliott Wave path for the stock.
-
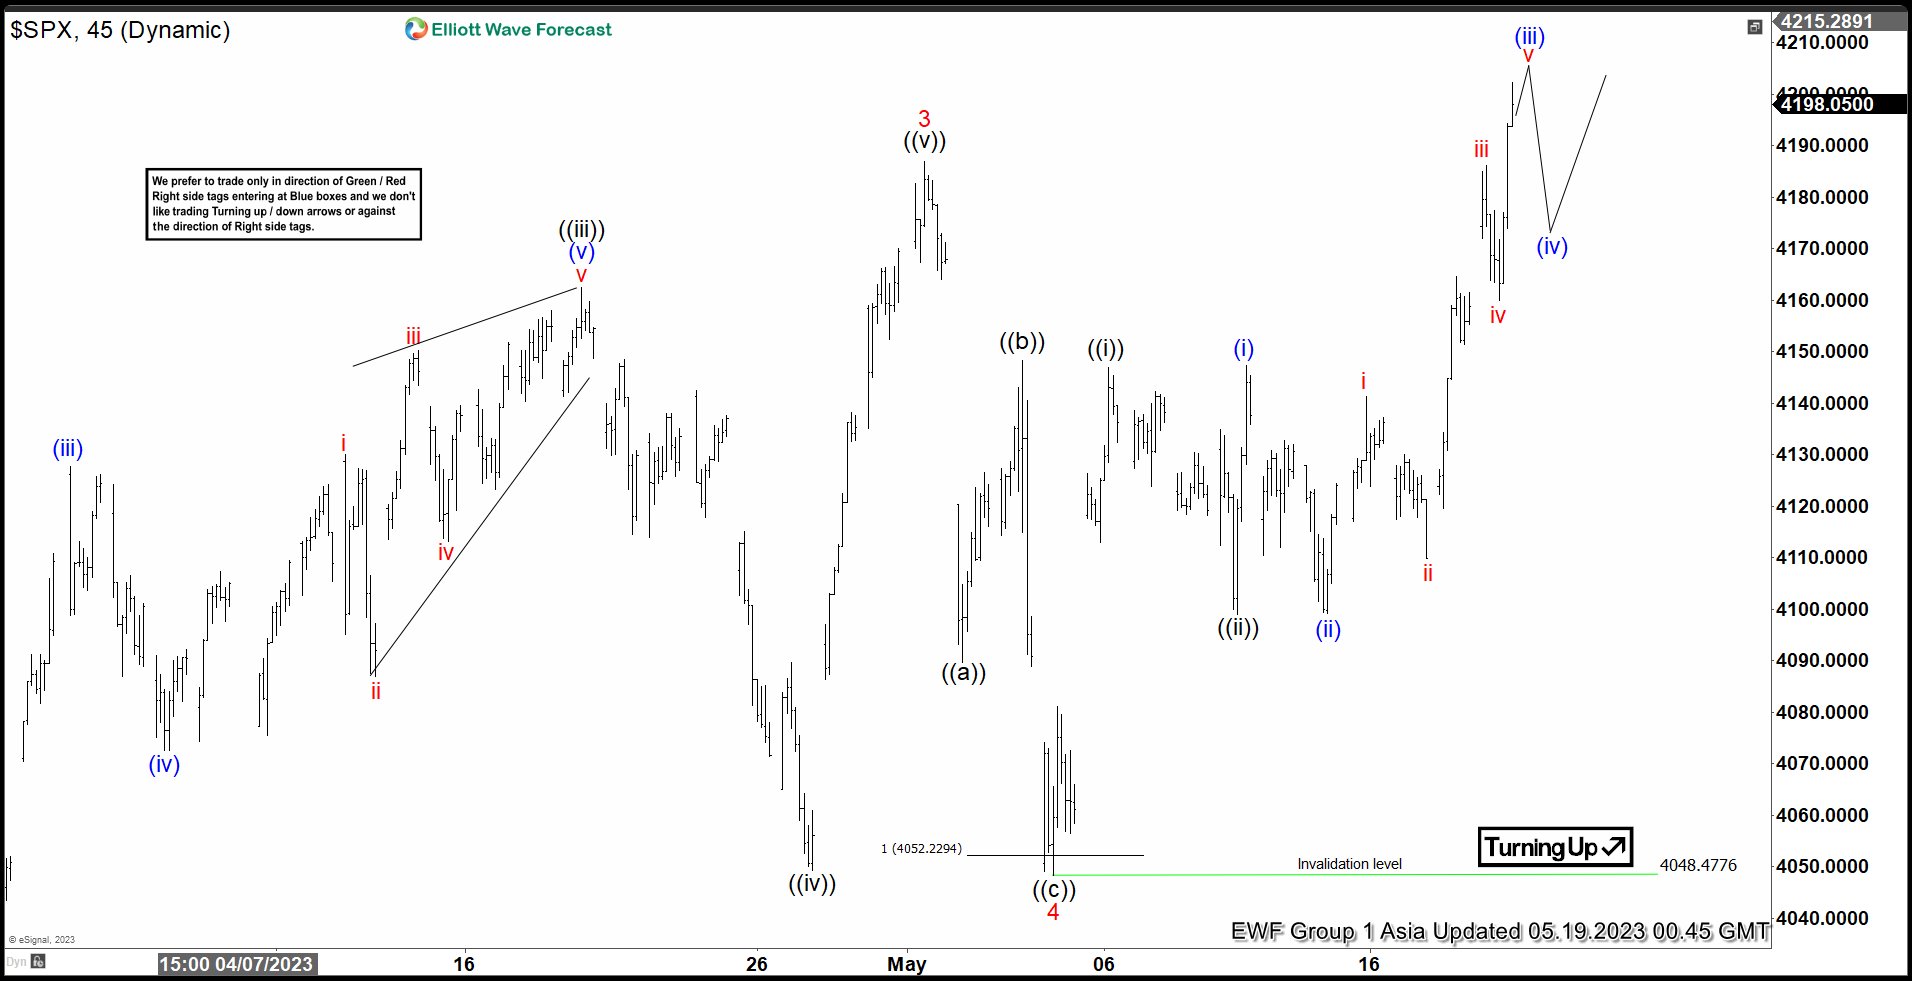
Elliott Wave View: S&P 500 (SPX) Has Started Wave 5 Higher
Read MoreSPX has started wave 5 in an impulsive structure favoring more upside. This article and video look at the Elliott Wave structure.
-
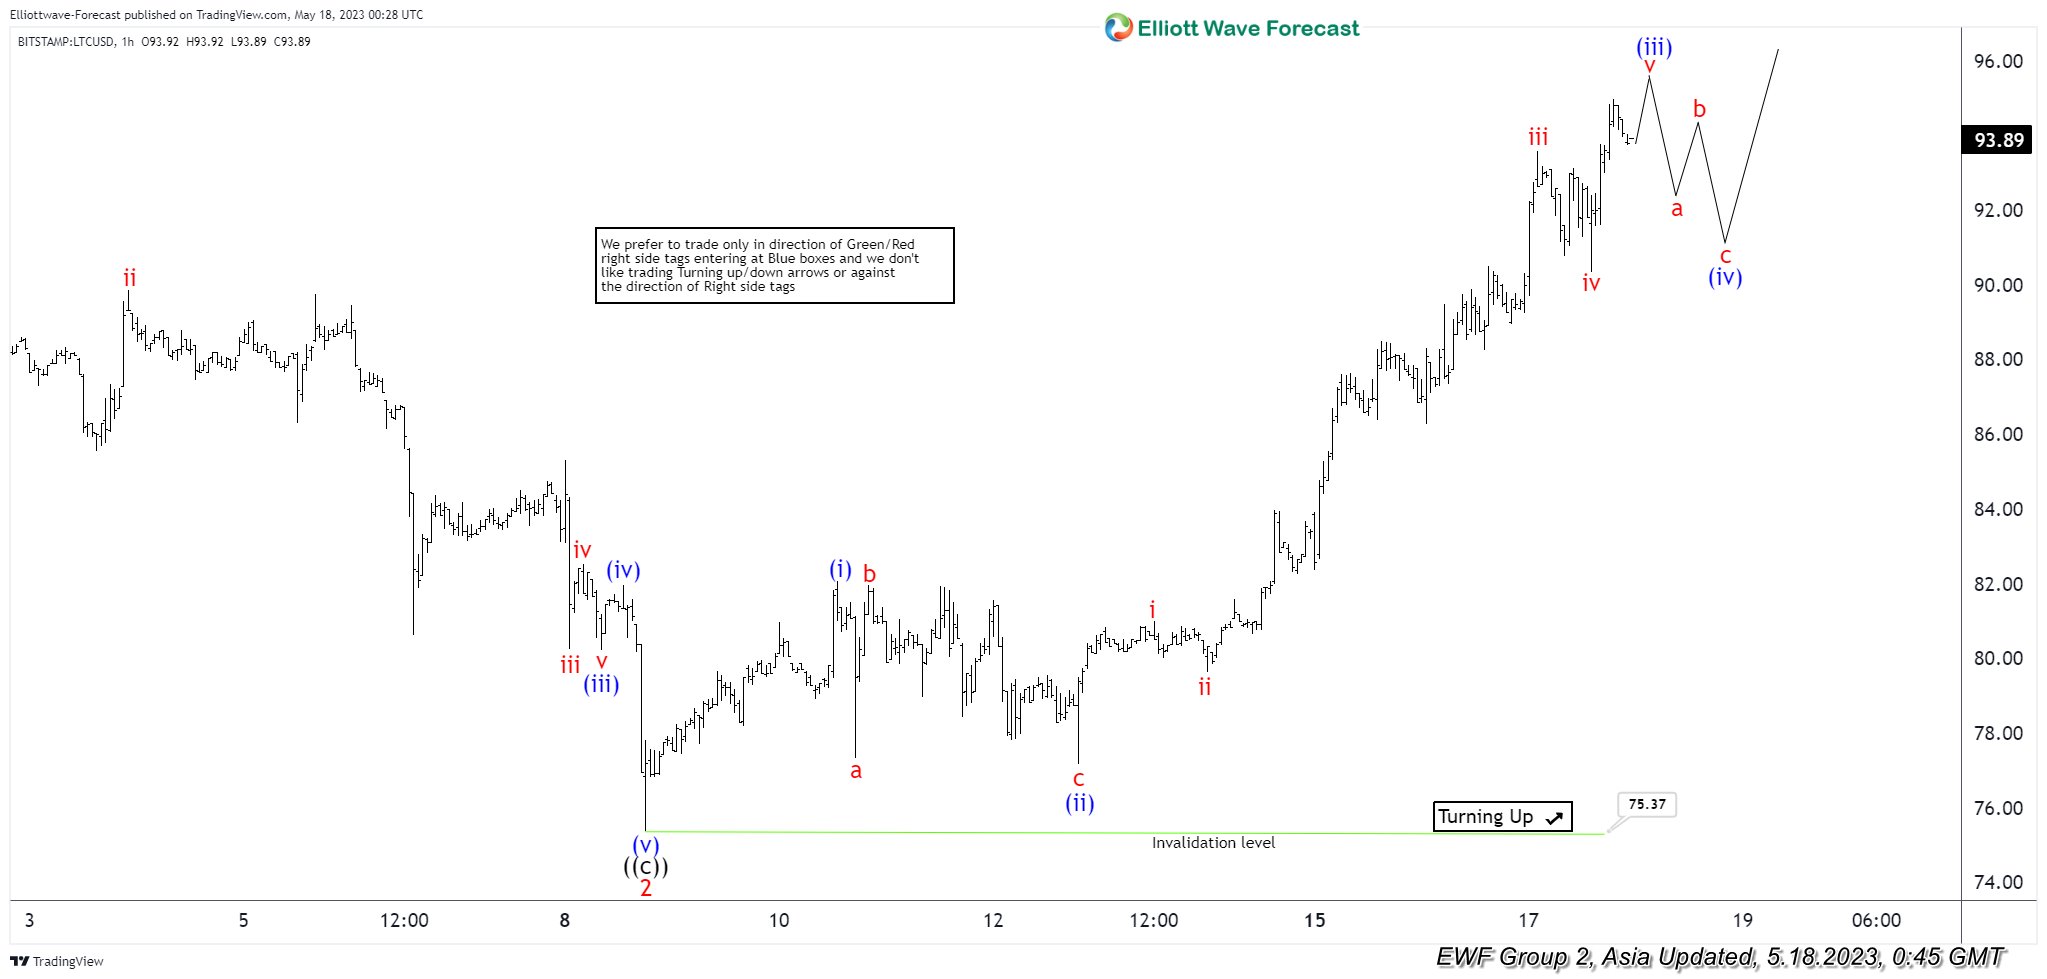
Analyzing Litecoin (LTCUSD) Impulsive Surge with Elliott Wave Theory
Read MoreLitecoin (LTCUSD) rallies from 5.8.2023 low as an impulse favoring further upside. This article and video look at the Elliott Wave path.
-
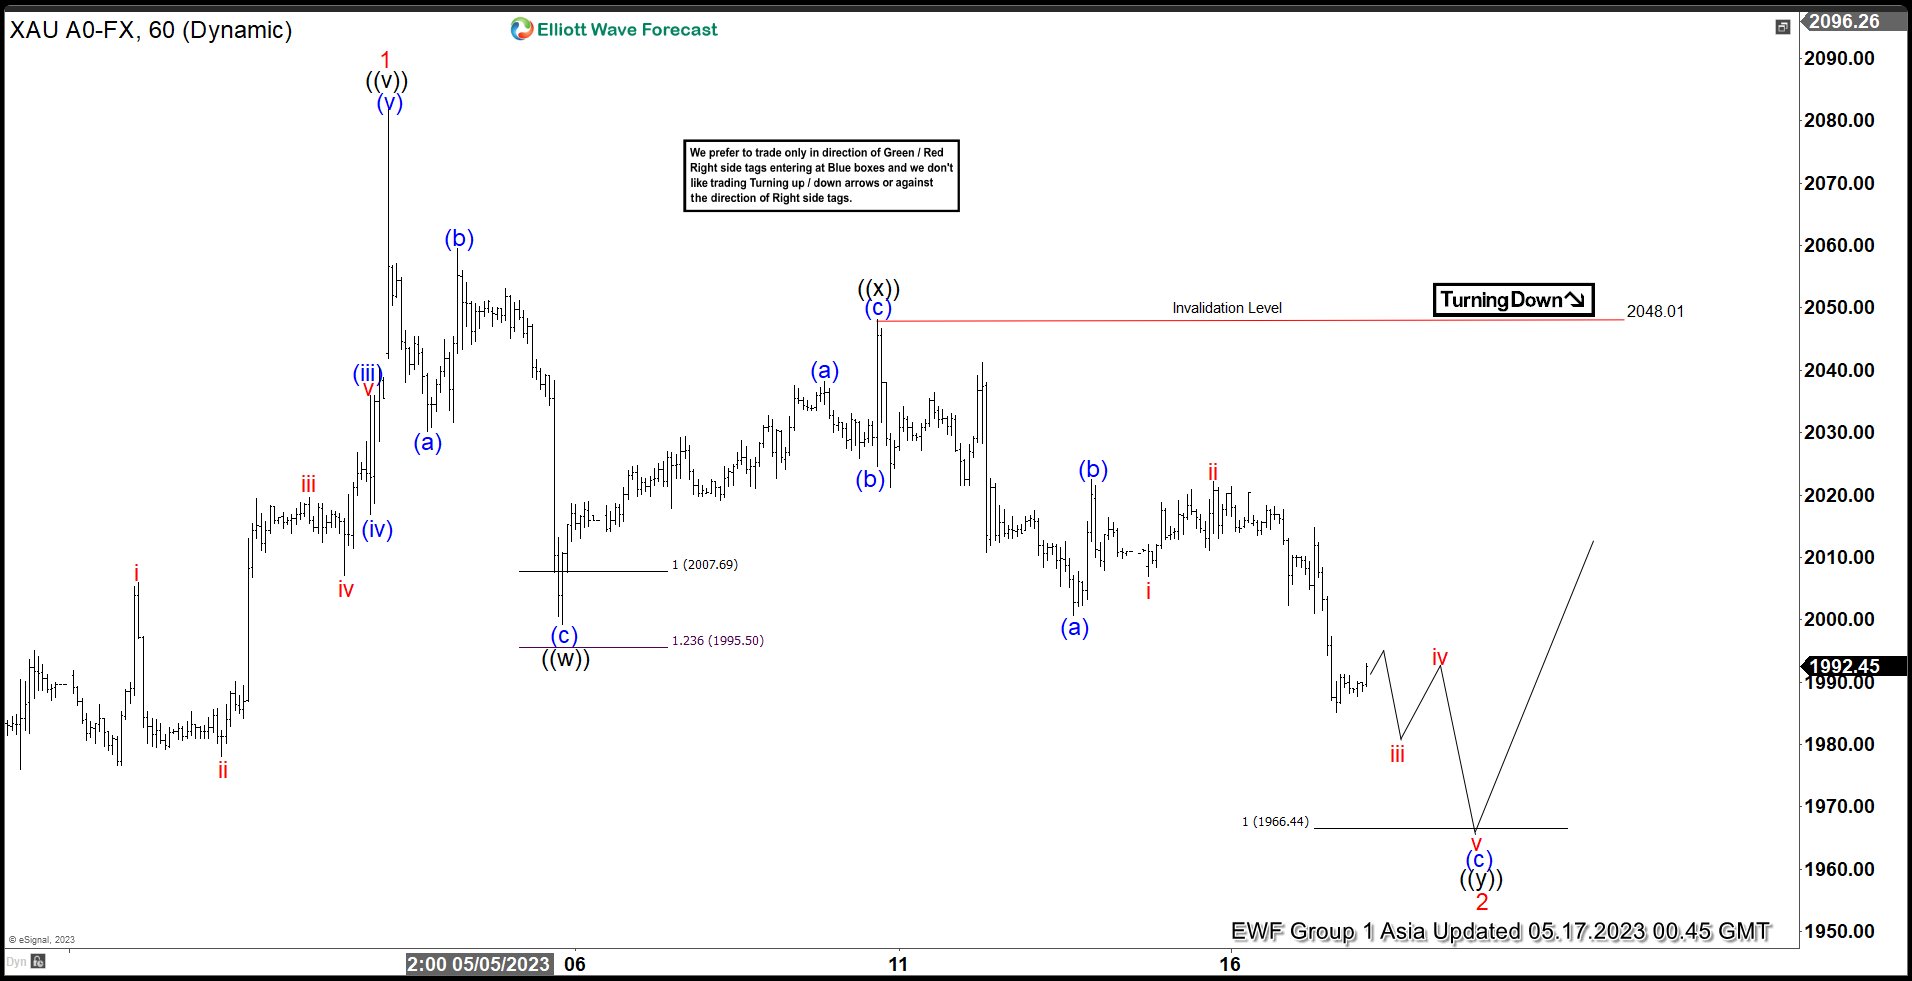
Gold (XAUUSD) Short Term Elliott Wave Support Area
Read MoreGold (XAUUSD) is correcting cycle from 2.28.2023 low in a double three Elliottwave structure. This article and video look at the support area for Gold.
-
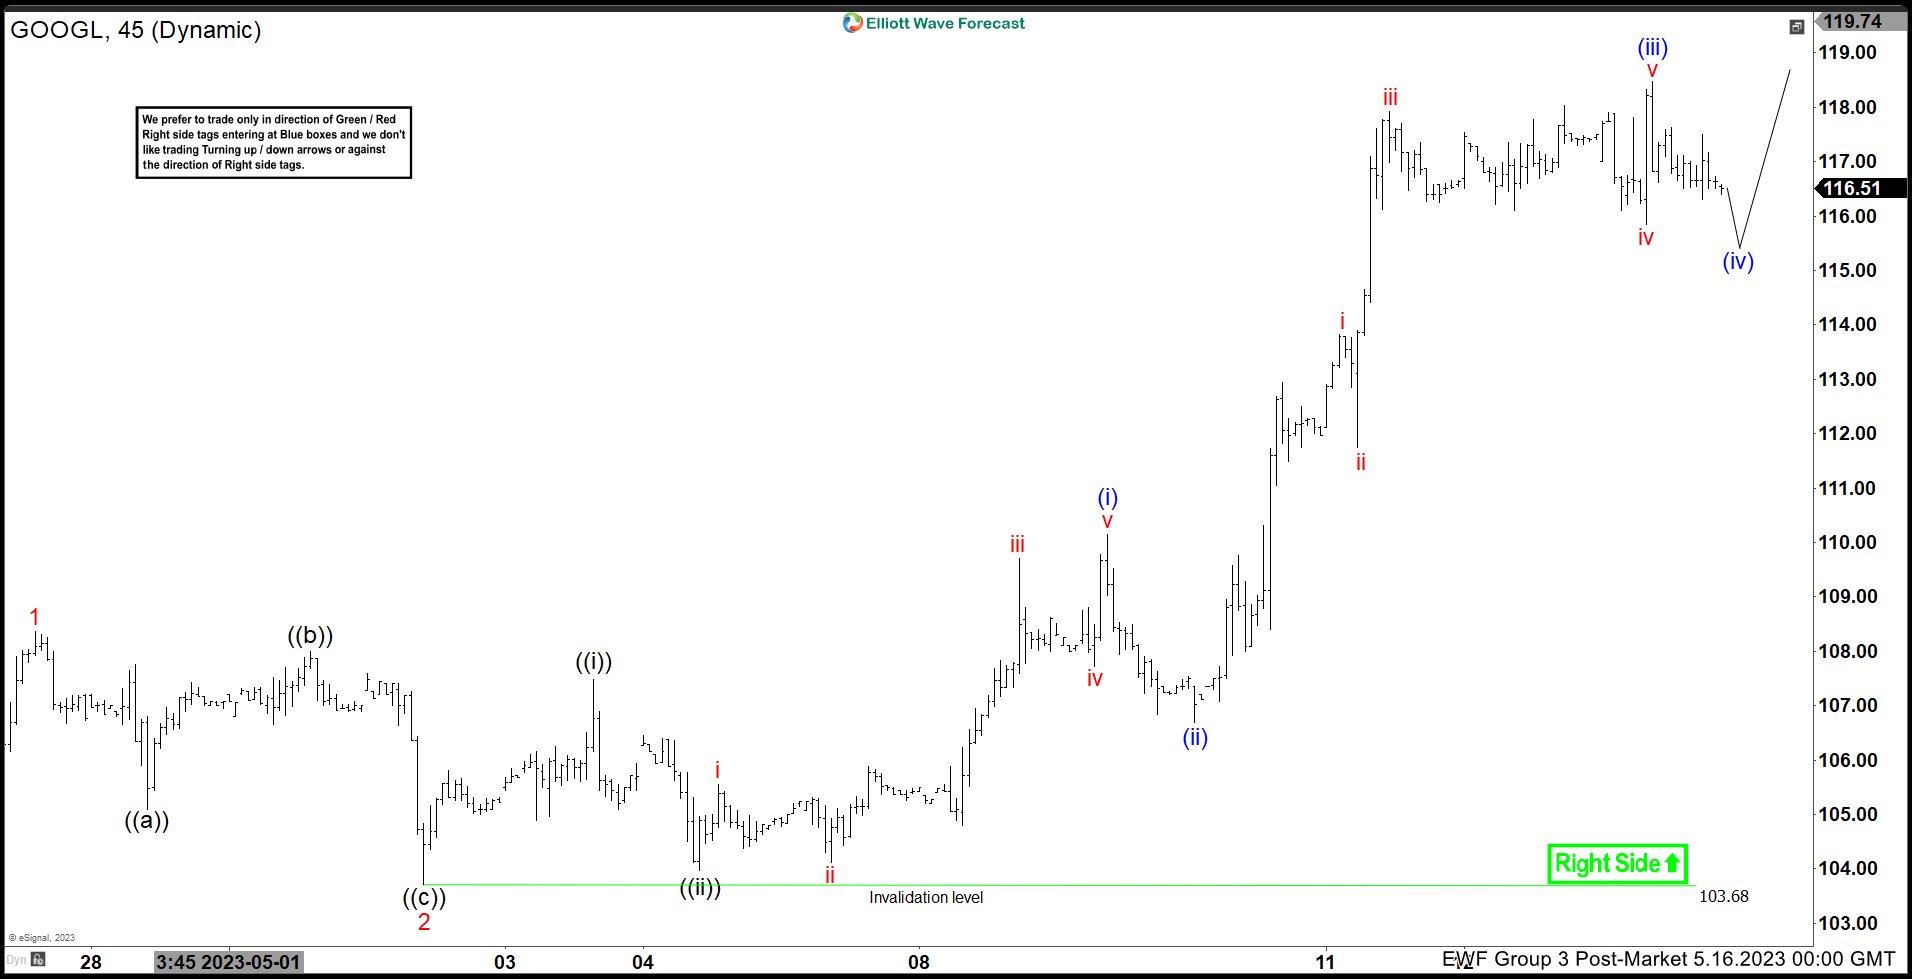
Google (GOOGL) Elliott Wave Impulsive Structure Incomplete
Read MoreGoogle (GOOGL) impulse structure from 5.2.2023 low looks incomplete favoring more upside. This article and video look at the Elliott Wave structure.