
-
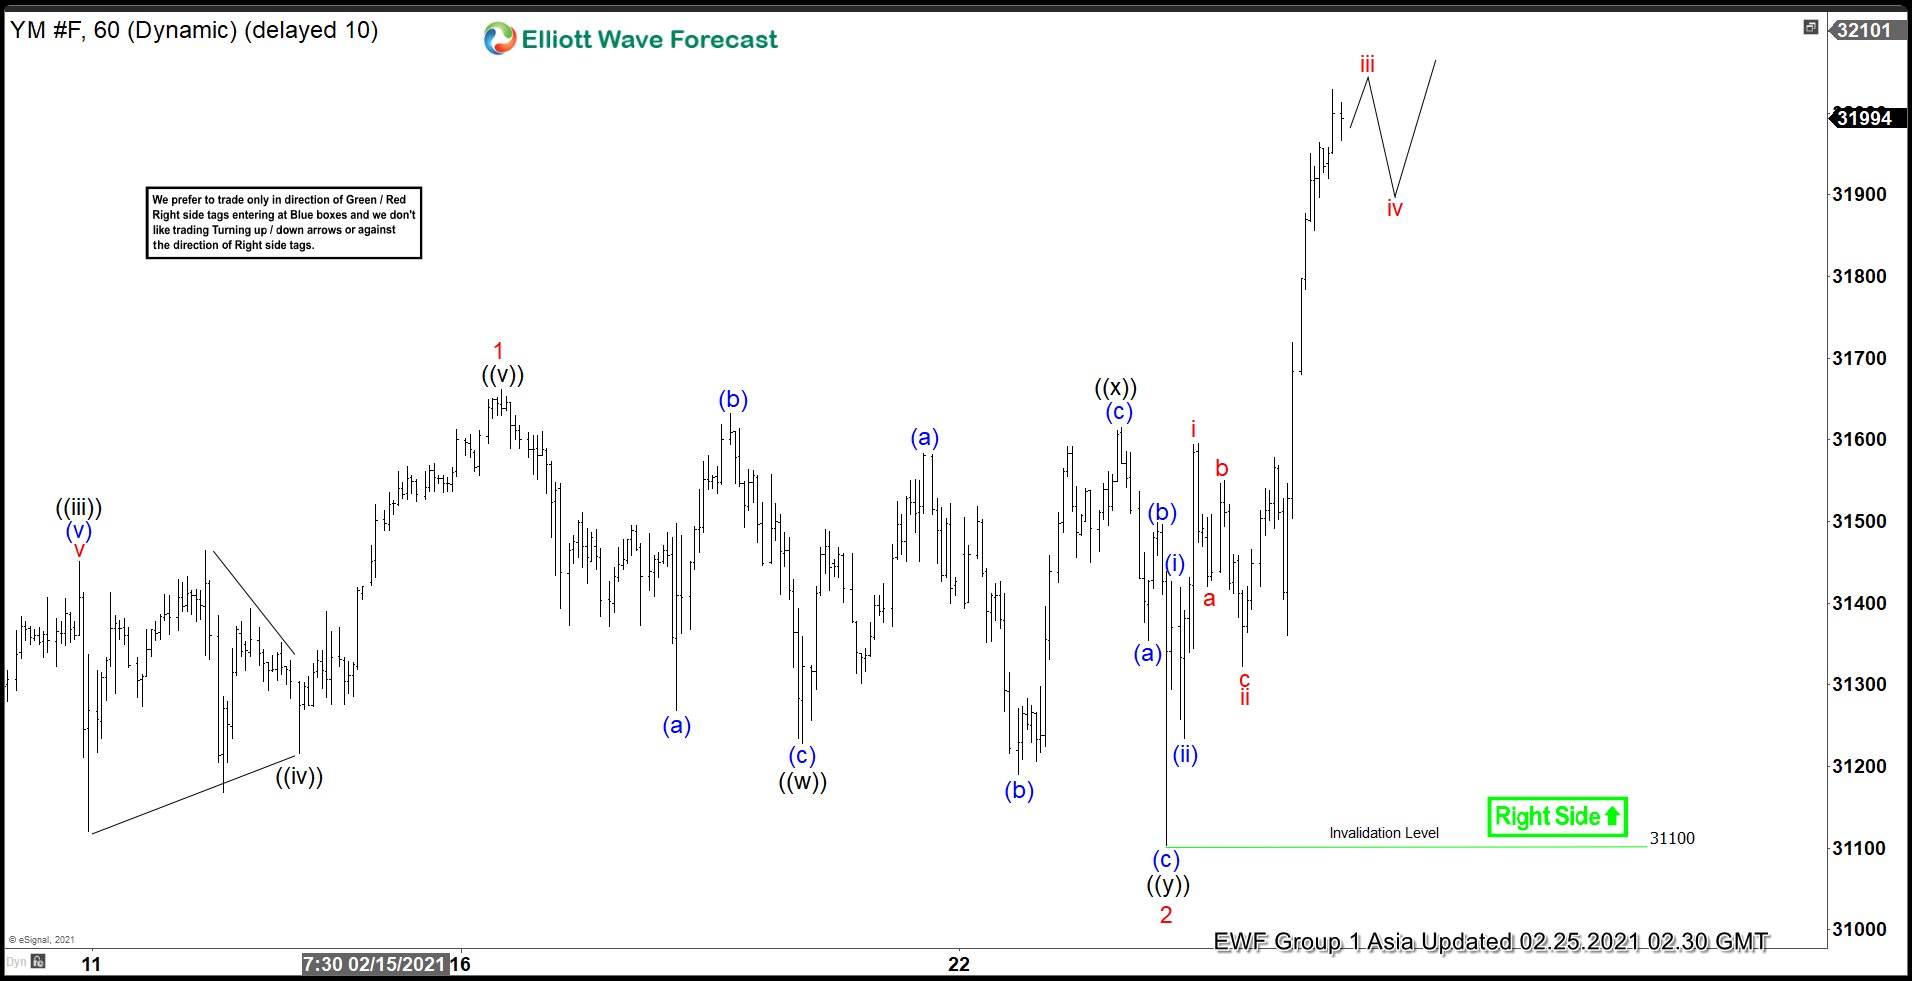
Elliott Wave View: Dow Futures (YM) Should Continue to Print All-Time High
Read MoreDow Futures has made an all time high and should continue higher. This article and video look at the Elliott Wave path of the Index.
-
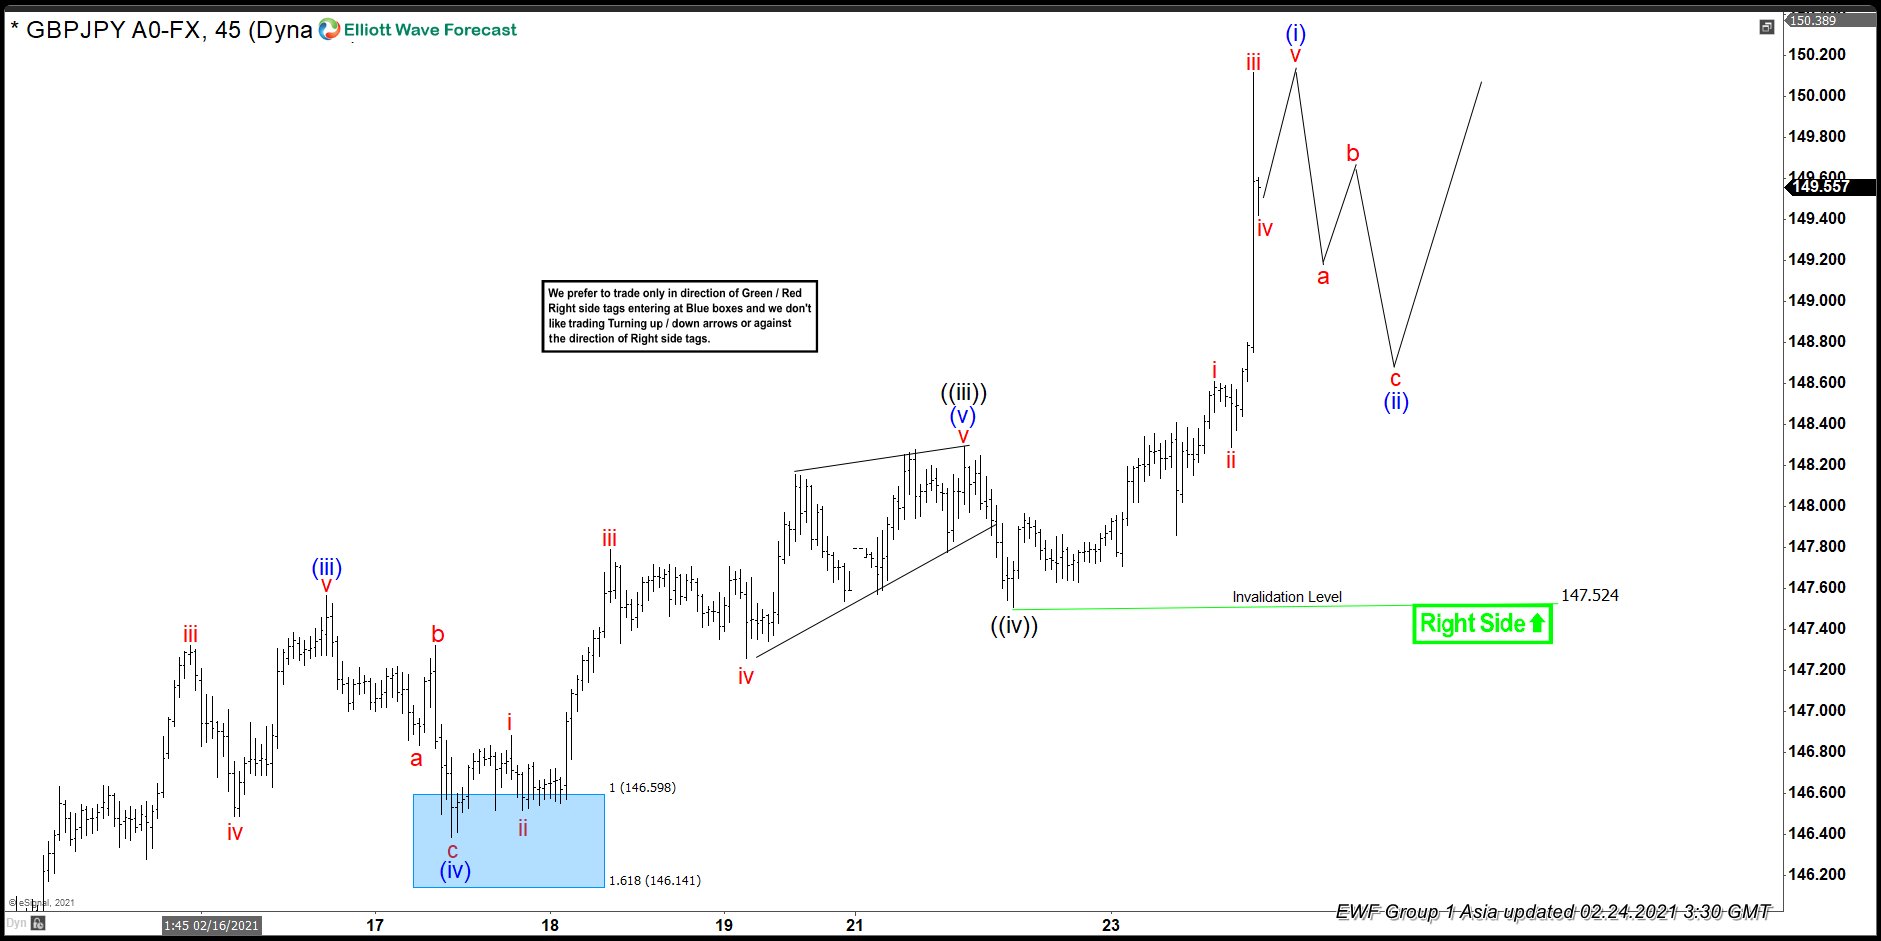
Elliott Wave View: GBPJPY Rally Likely to Extend Higher
Read MoreGBPJPY rally in impulsive structure from January 18 low and pullback likely continues to be supported. This article and video look at the Elliott Wave path.
-
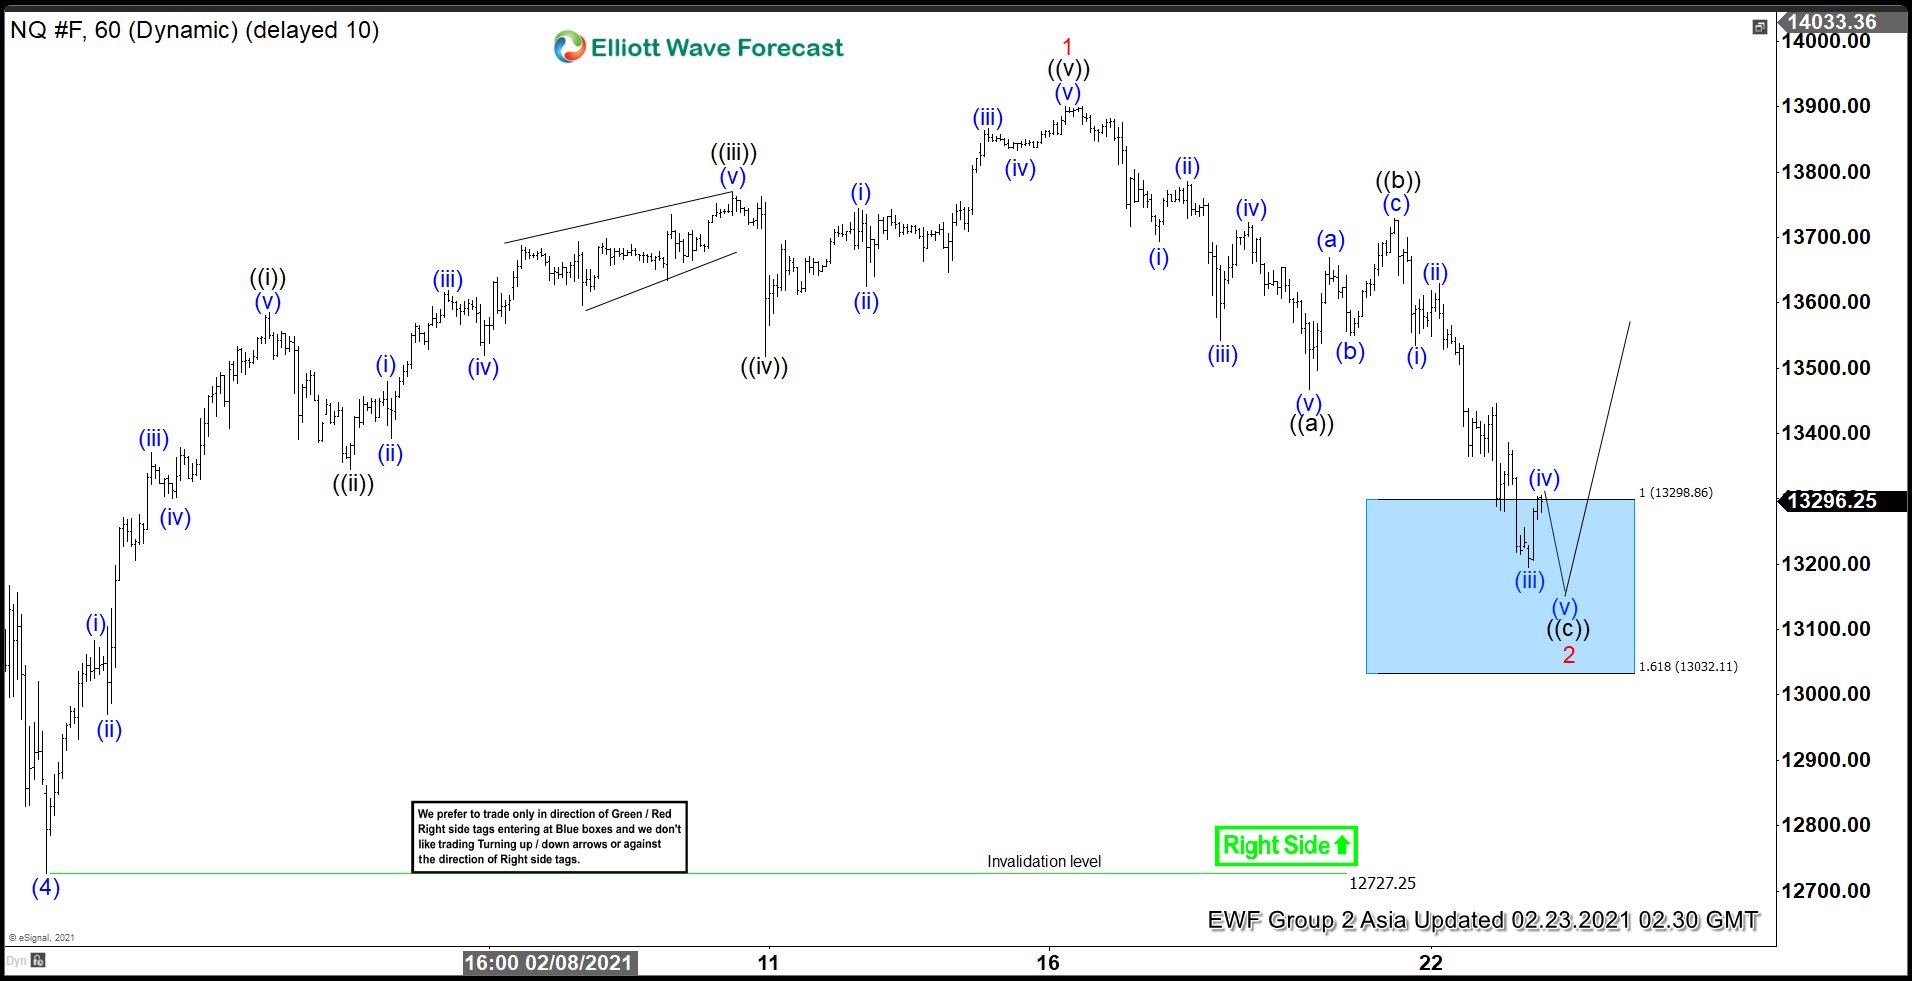
Elliott Wave View: Nasdaq at Support Area
Read MoreNasdaq has reached the support area from February 16 high and soon can see buyers for more upside. This article and video look at the Elliott Wave path.
-
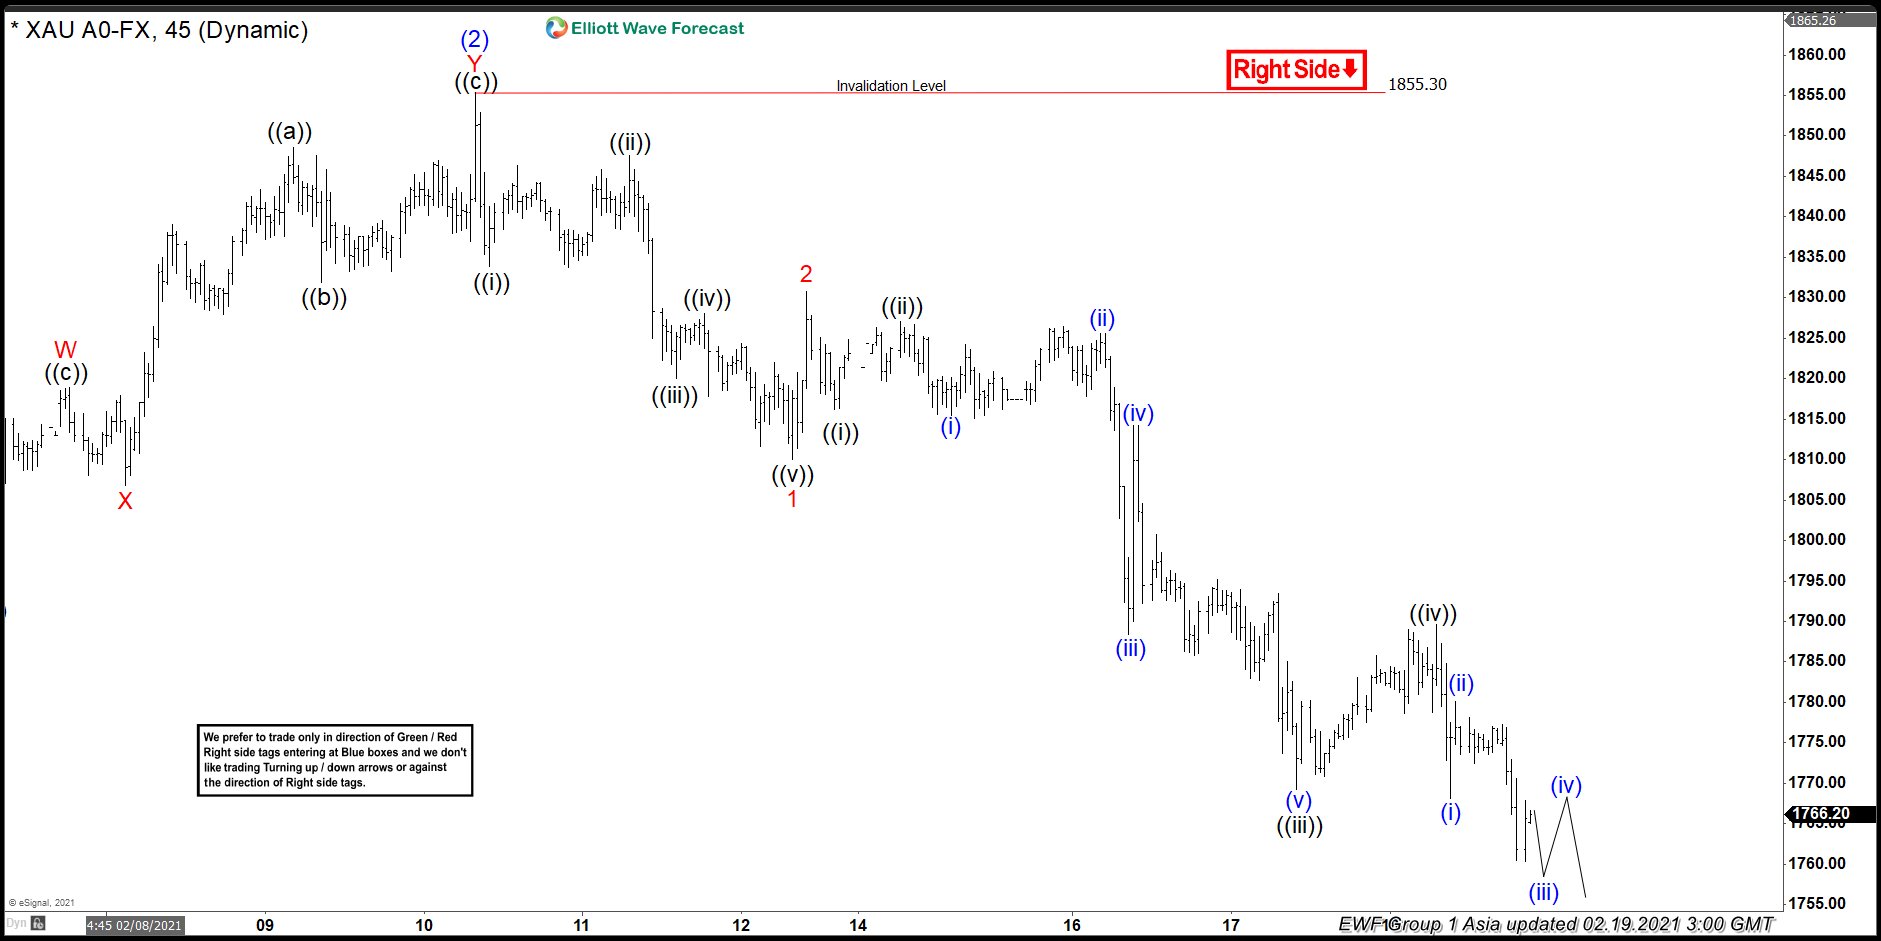
Elliott Wave View: Further Downside in Gold
Read MoreGold has broken below last year low suggesting it has further downside. This article and video look at the Elliott Wave path.
-
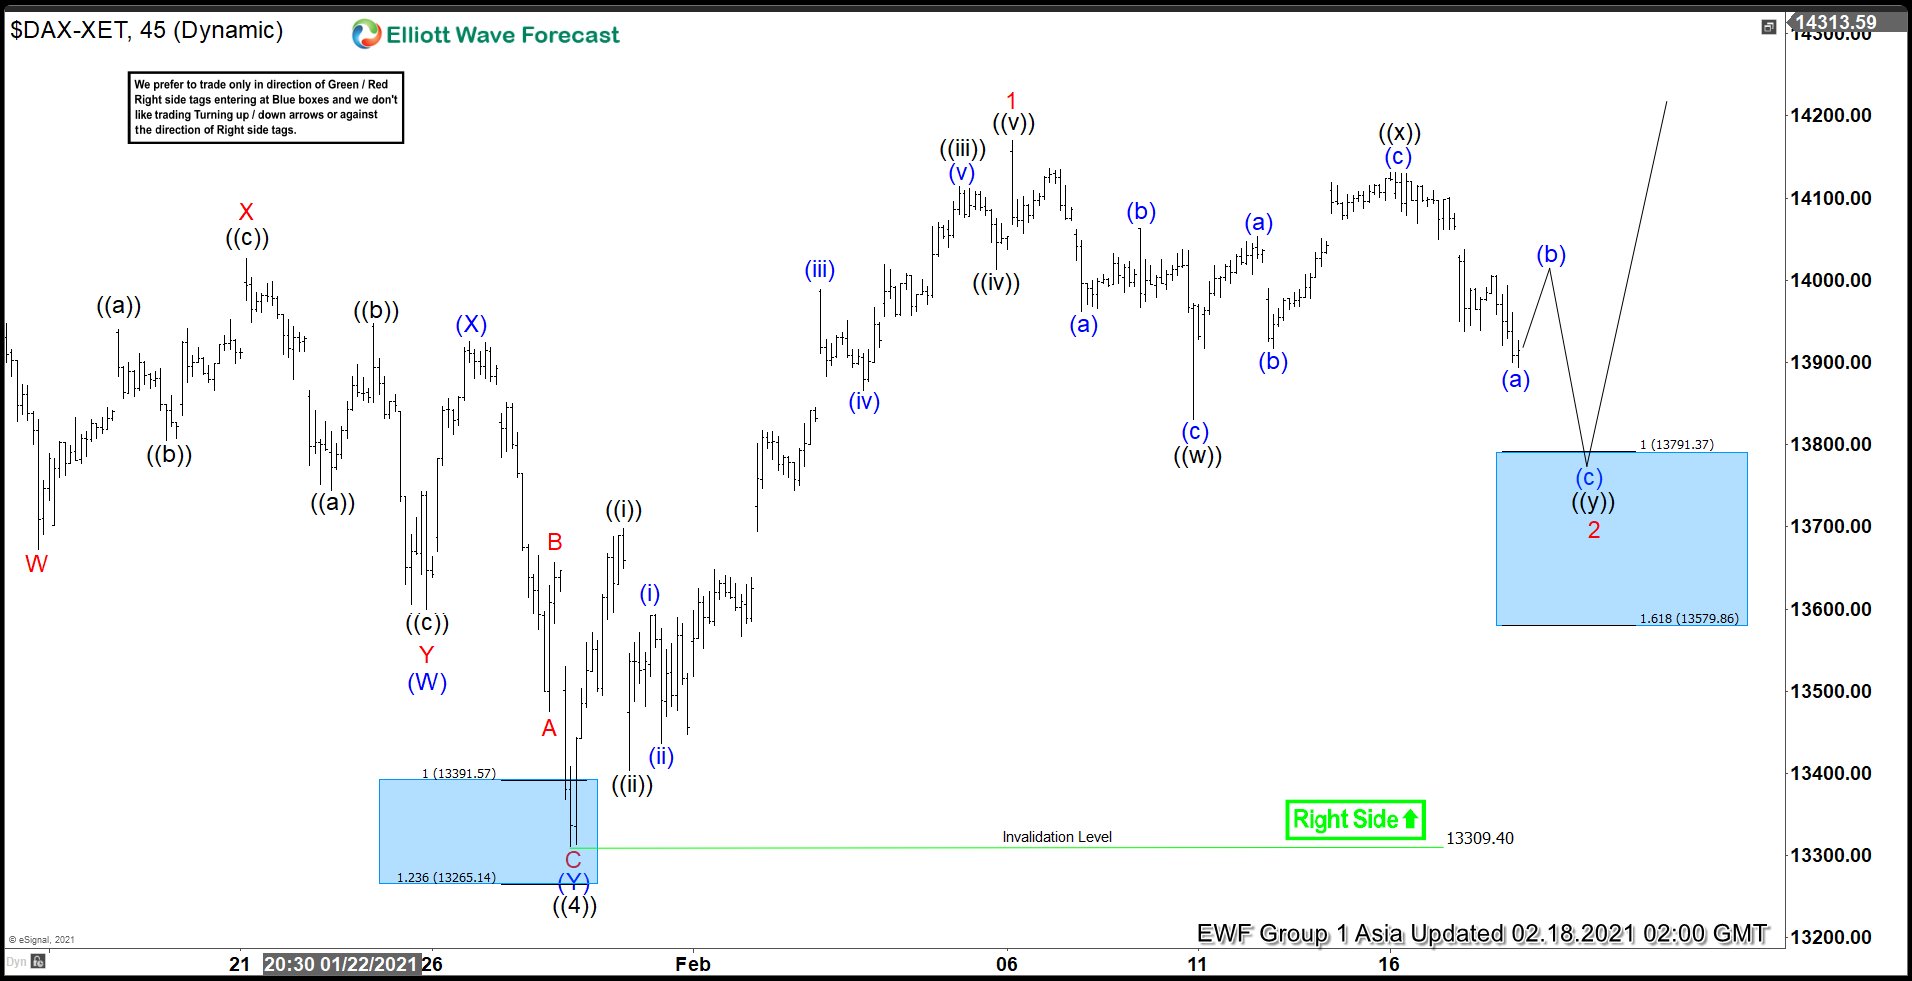
Elliott Wave View: Pullback in DAX Should Find Buyers
Read MoreDAX has scope to extend pullback in 7 swing structure. This article and video look at the Elliott Wave path of the Index.
-
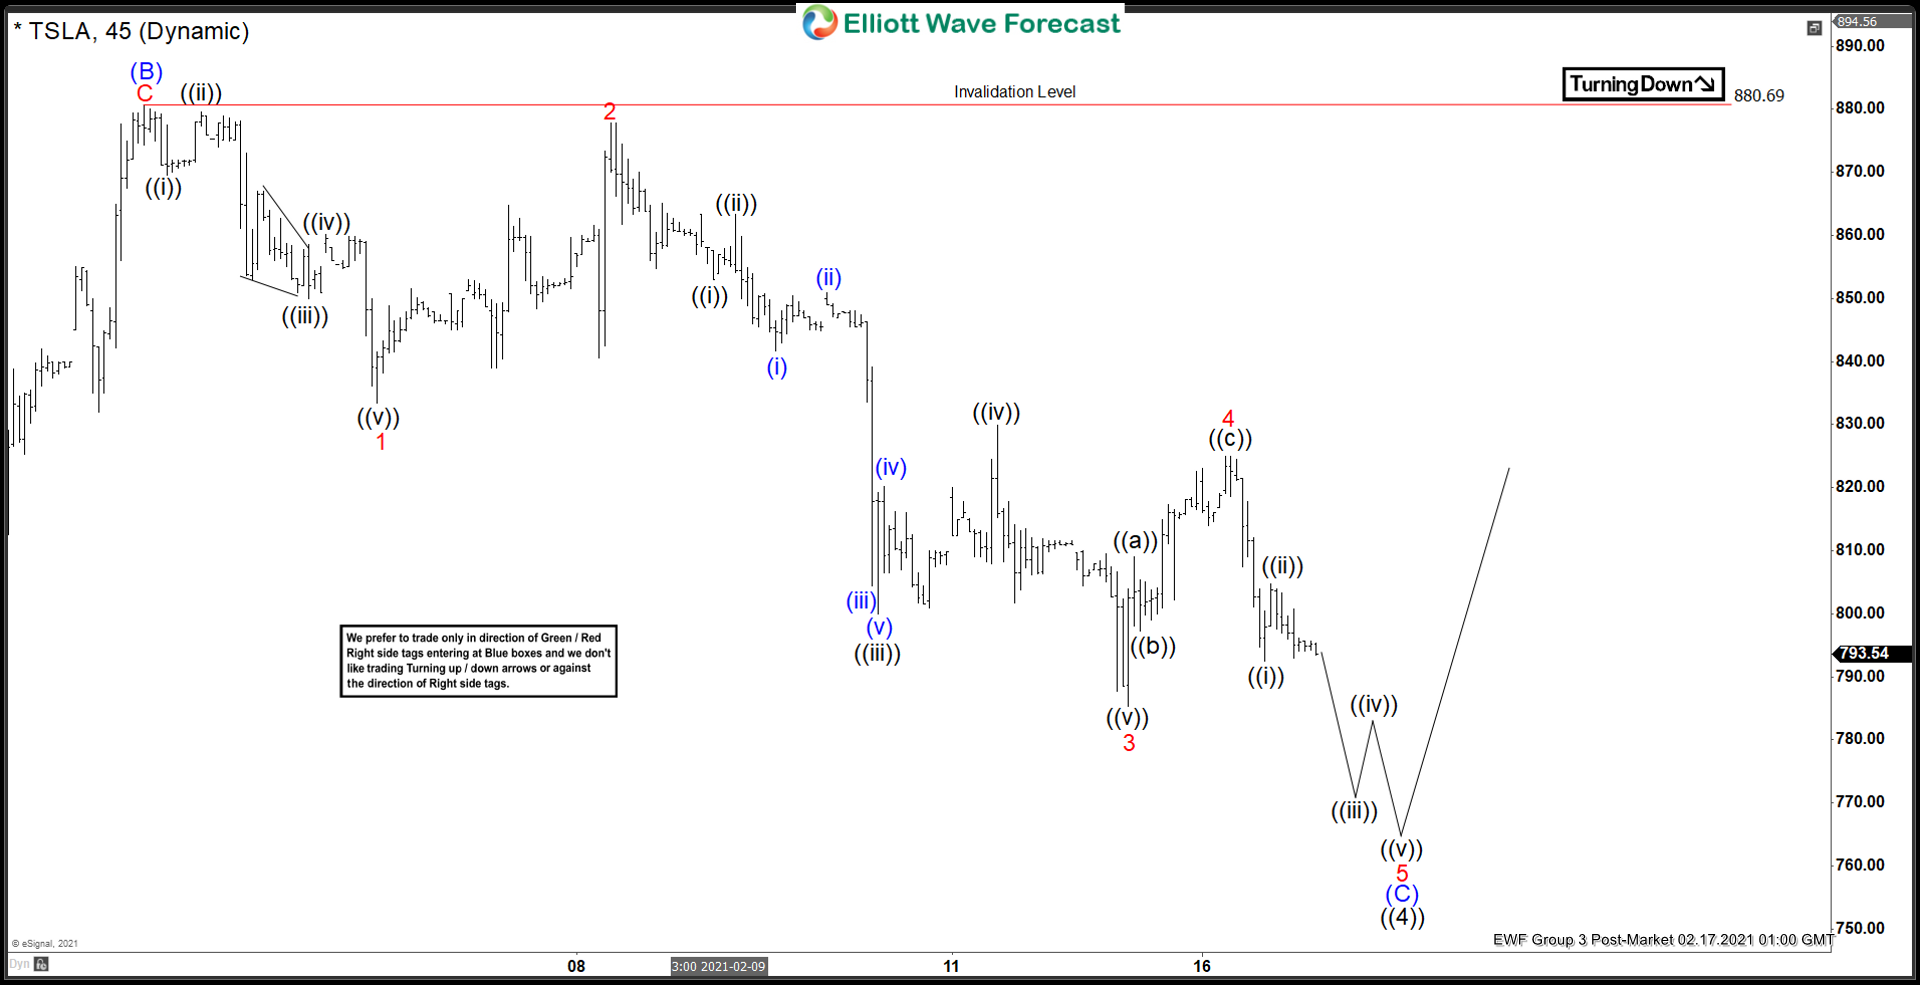
Elliott Wave View: Tesla (TSLA) Approaching Support
Read MoreTesla is approaching support area where buyers can be seen. This article and video look at the short term Elliott Wave path.