
-

GBPNZD Reacting Strongly From The Blue Box Area
Read MoreIn this technical blog, we will look at the past performance of the 4-hour Elliott Wave Charts of GBPNZD. In which, the rally from the 03 February 2023 low unfolded as an impulse sequence and showed a higher high sequence with a bullish sequence stamp. Therefore, we knew that the structure in GBPNZD is incomplete & should […]
-
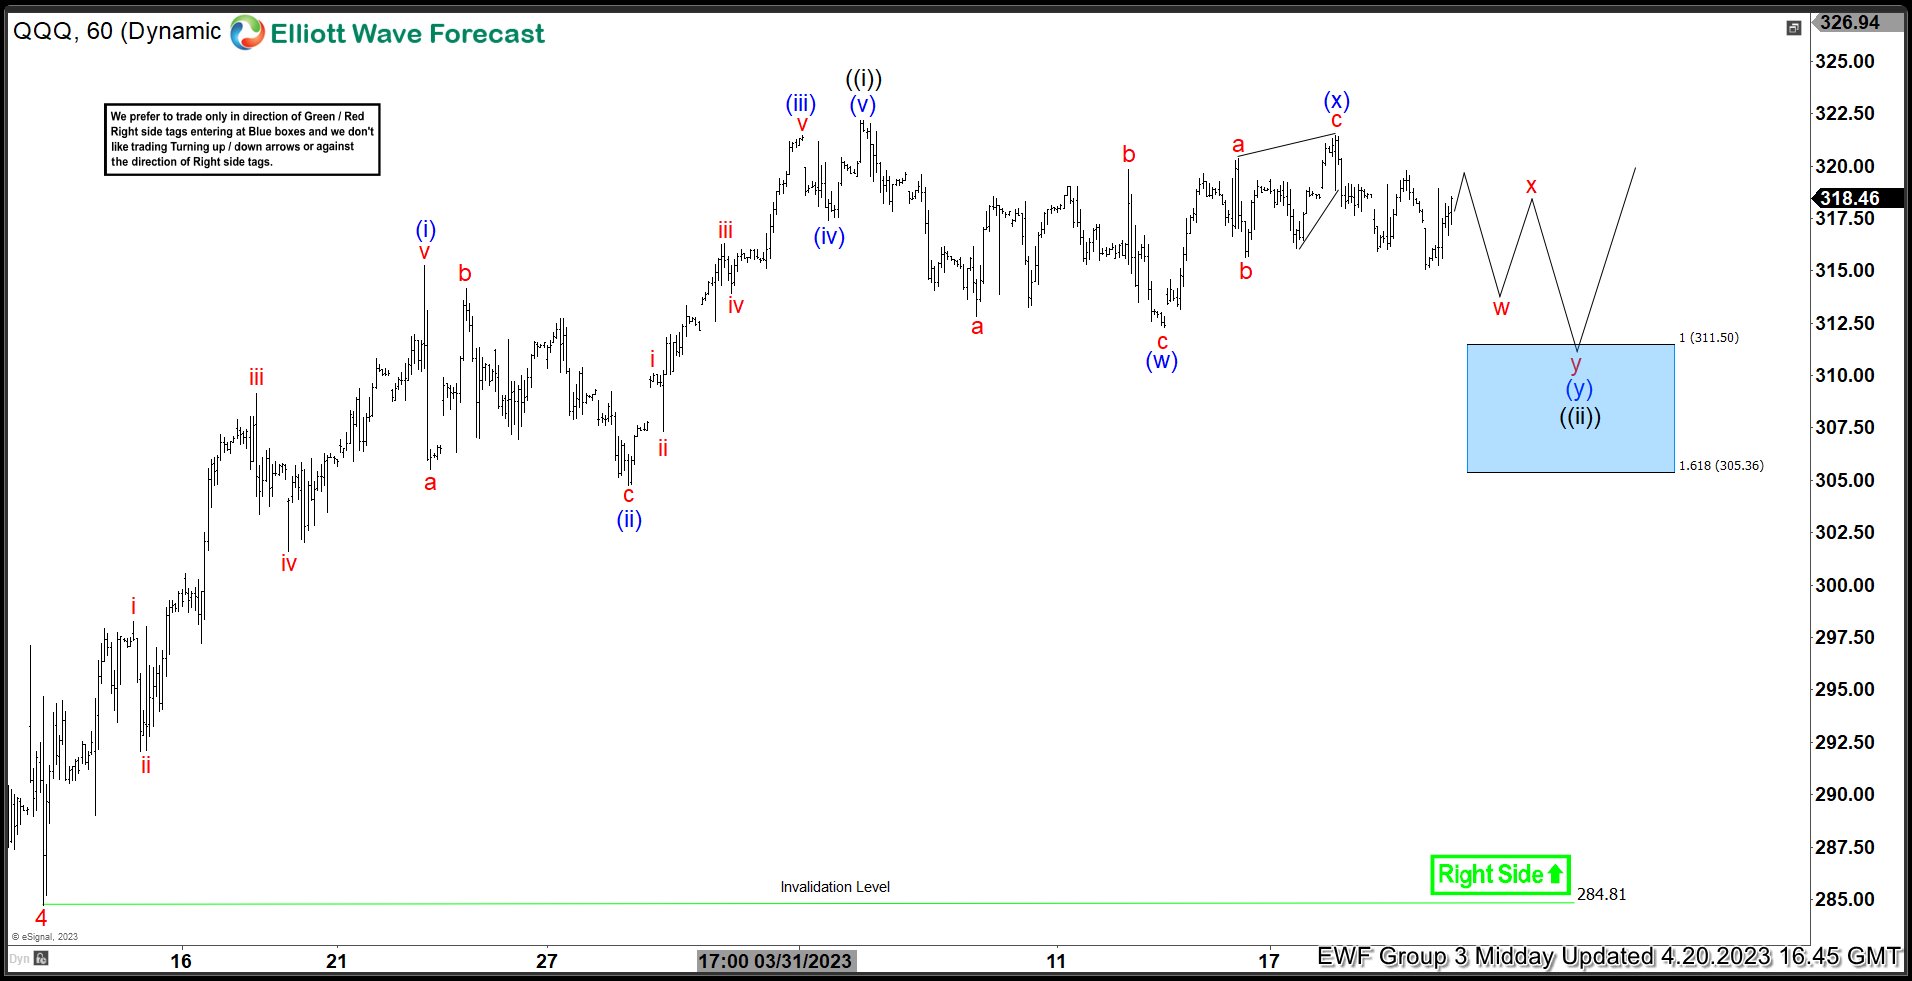
QQQ Doing Strong Reaction Higher From Blue Box Area
Read MoreIn this blog, we take a look at the past performance of QQQ charts. The ETF provided a buying opportunity in the blue box area.
-
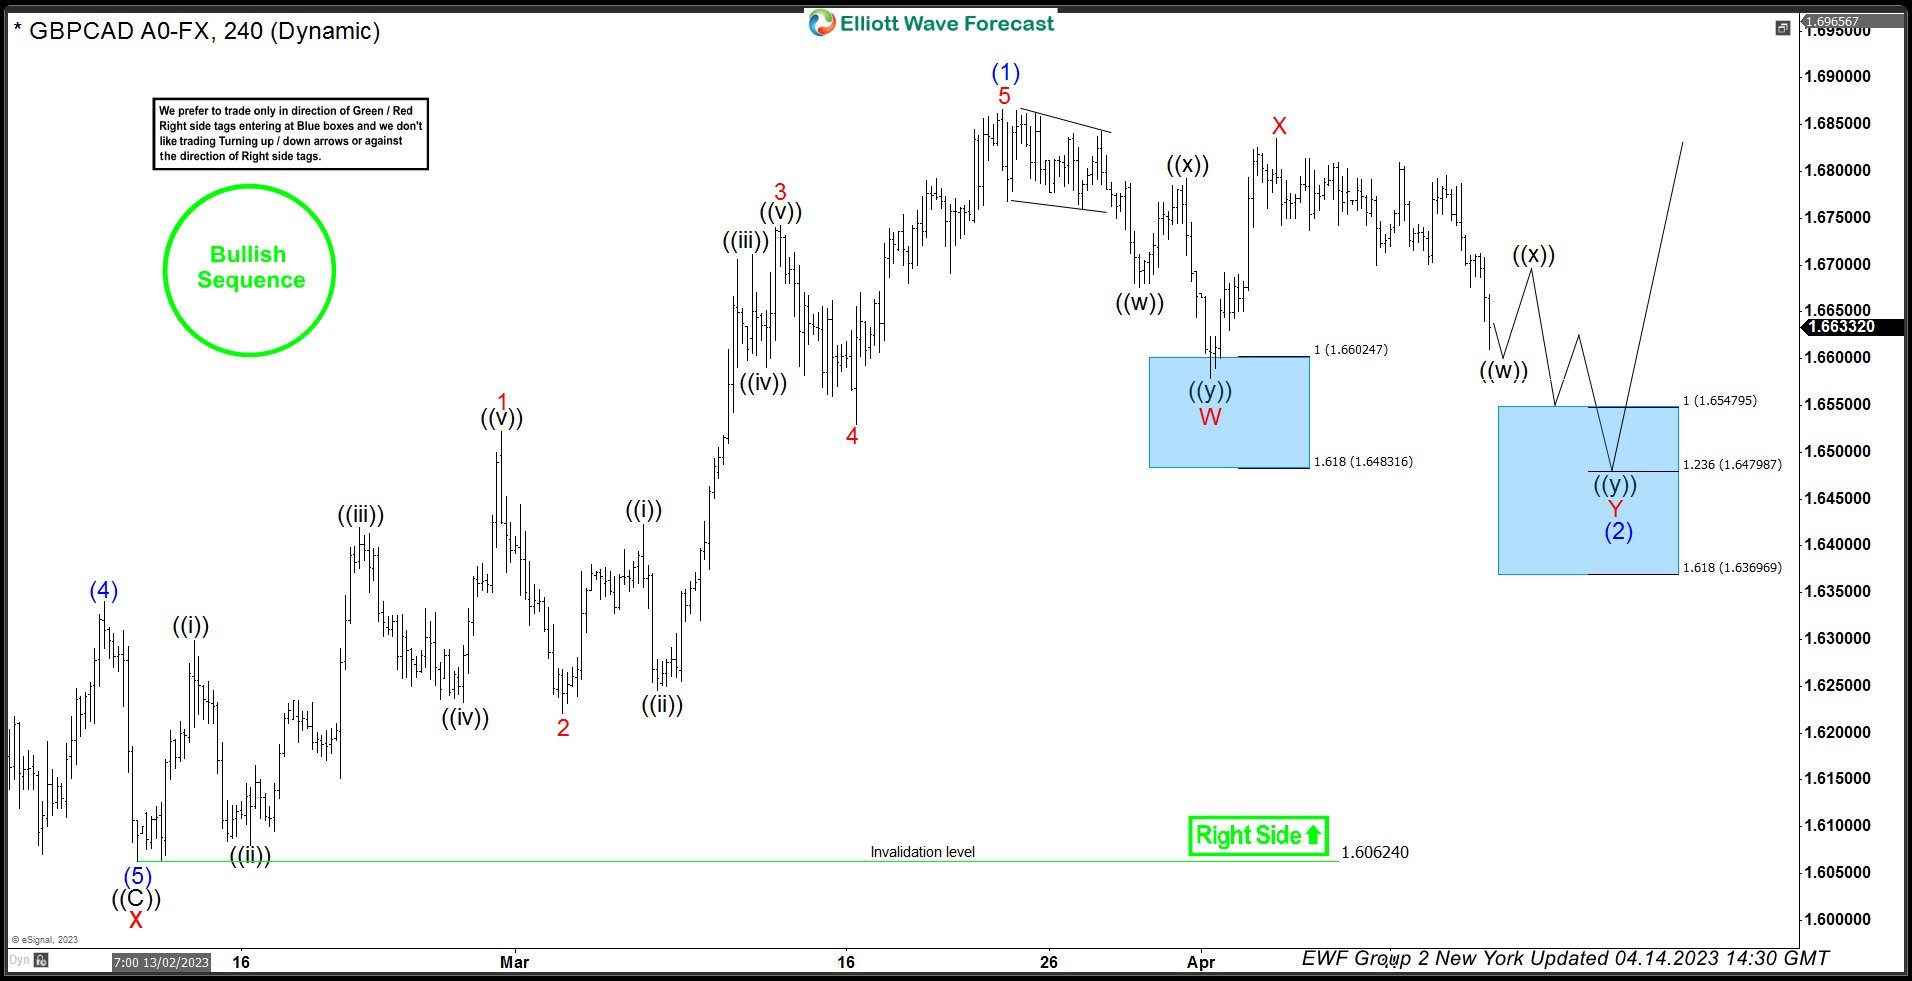
GBPCAD Another Blue Box Offered Another Buying Opportunity
Read MoreIn this technical blog, we will look at the past performance of the 4-hour Elliott Wave Charts of GBPCAD. In which, the rally from the 10 February 2023 low unfolded as an impulse sequence and showed a higher high sequence with a bullish sequence stamp. Therefore, we knew that the structure in GBPCAD is incomplete & should […]
-
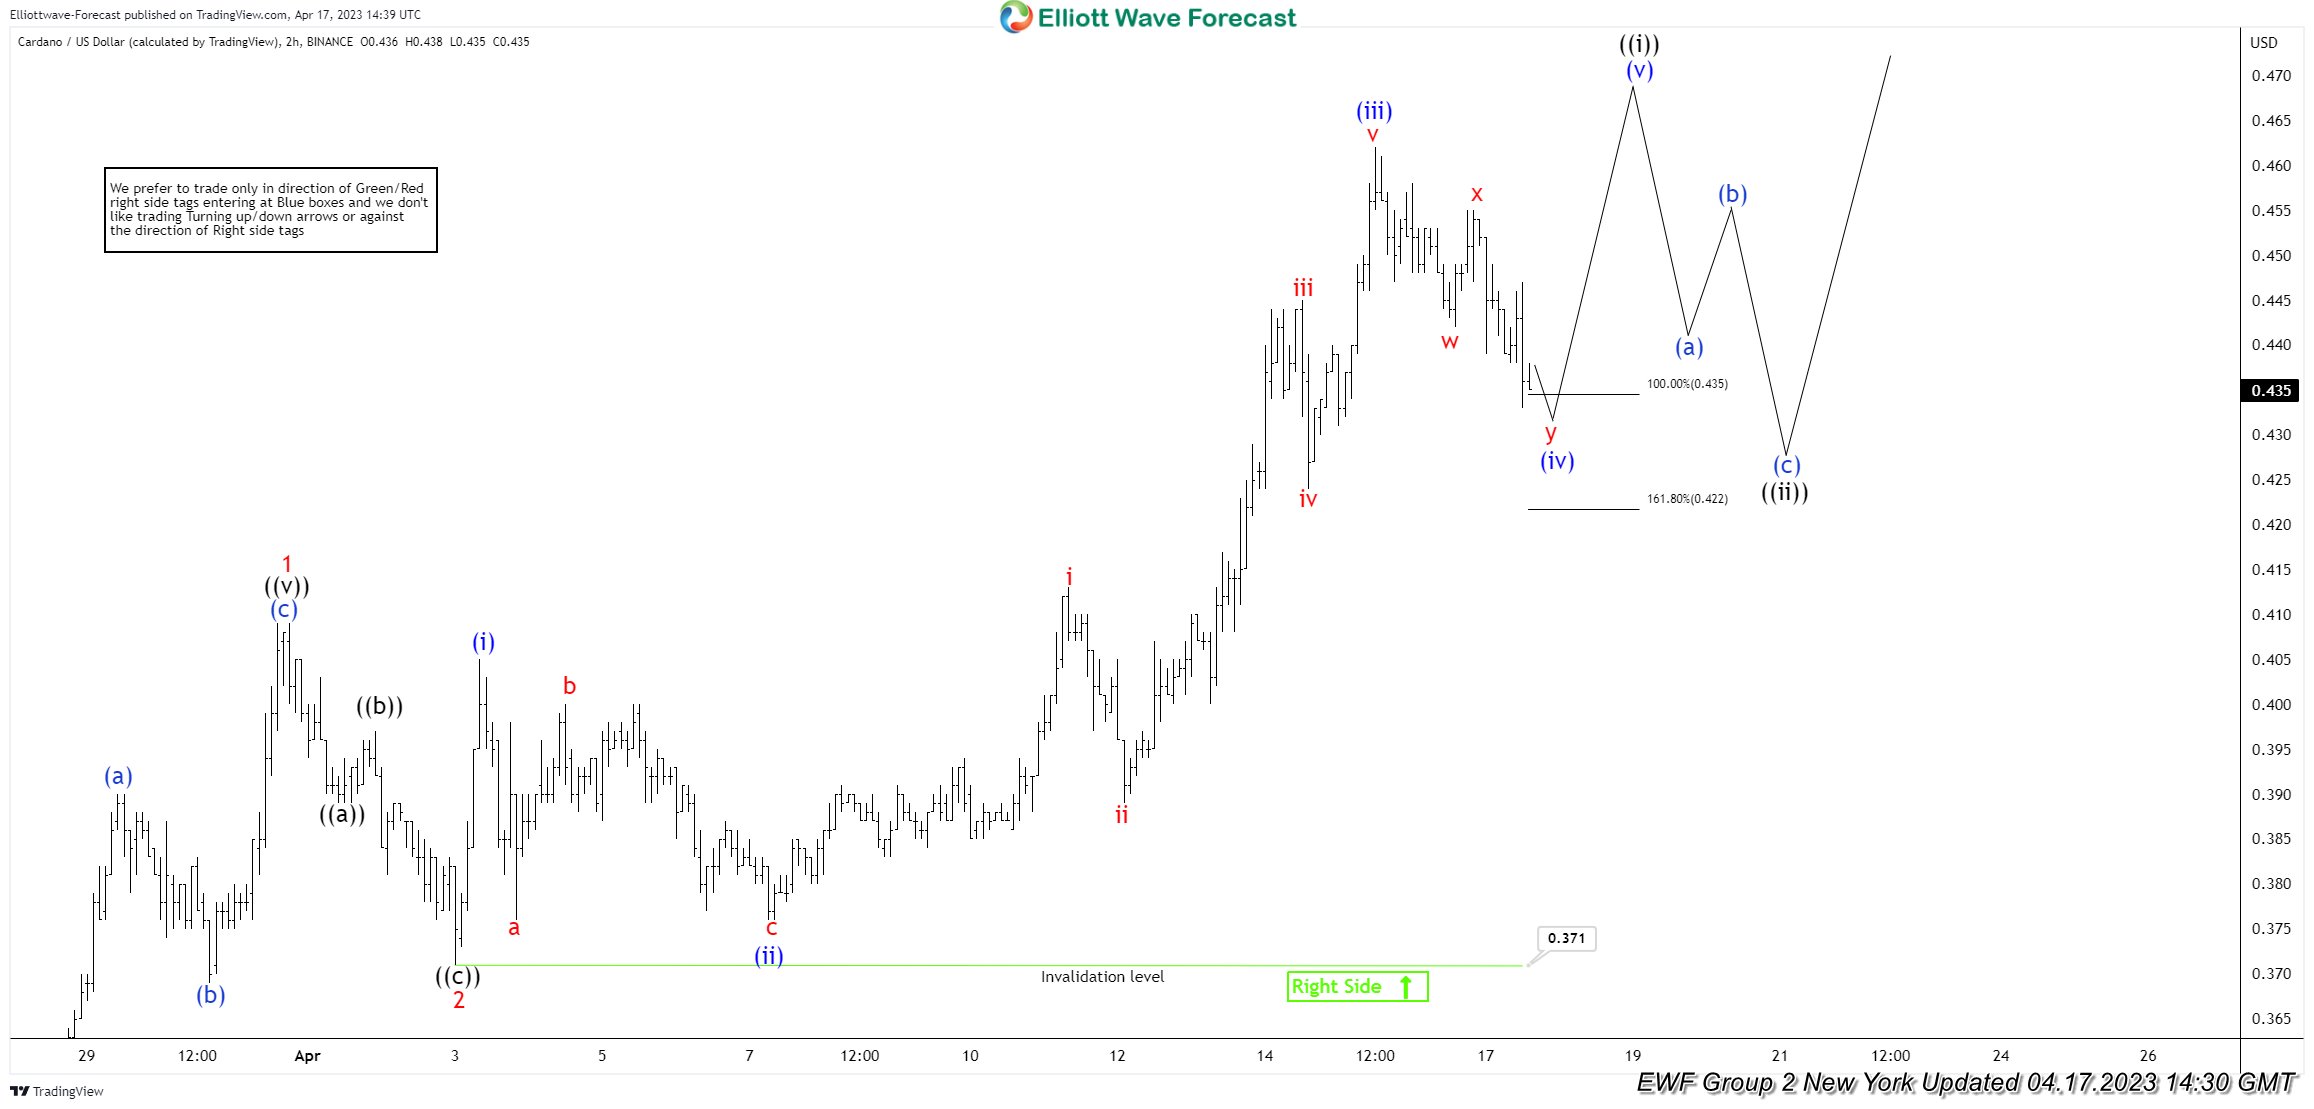
Cardano Reacting Higher From The Equal Legs Area
Read MoreIn this technical blog, we will look at the past performance of the 1-hour Elliott Wave Charts of the Cardano ticker symbol: $ADAUSD. The rally from the 10 March 2023 low showed a higher high sequence & provided a short-term extreme trading opportunity. In this case, the pullback managed to reach the equal legs area […]
-
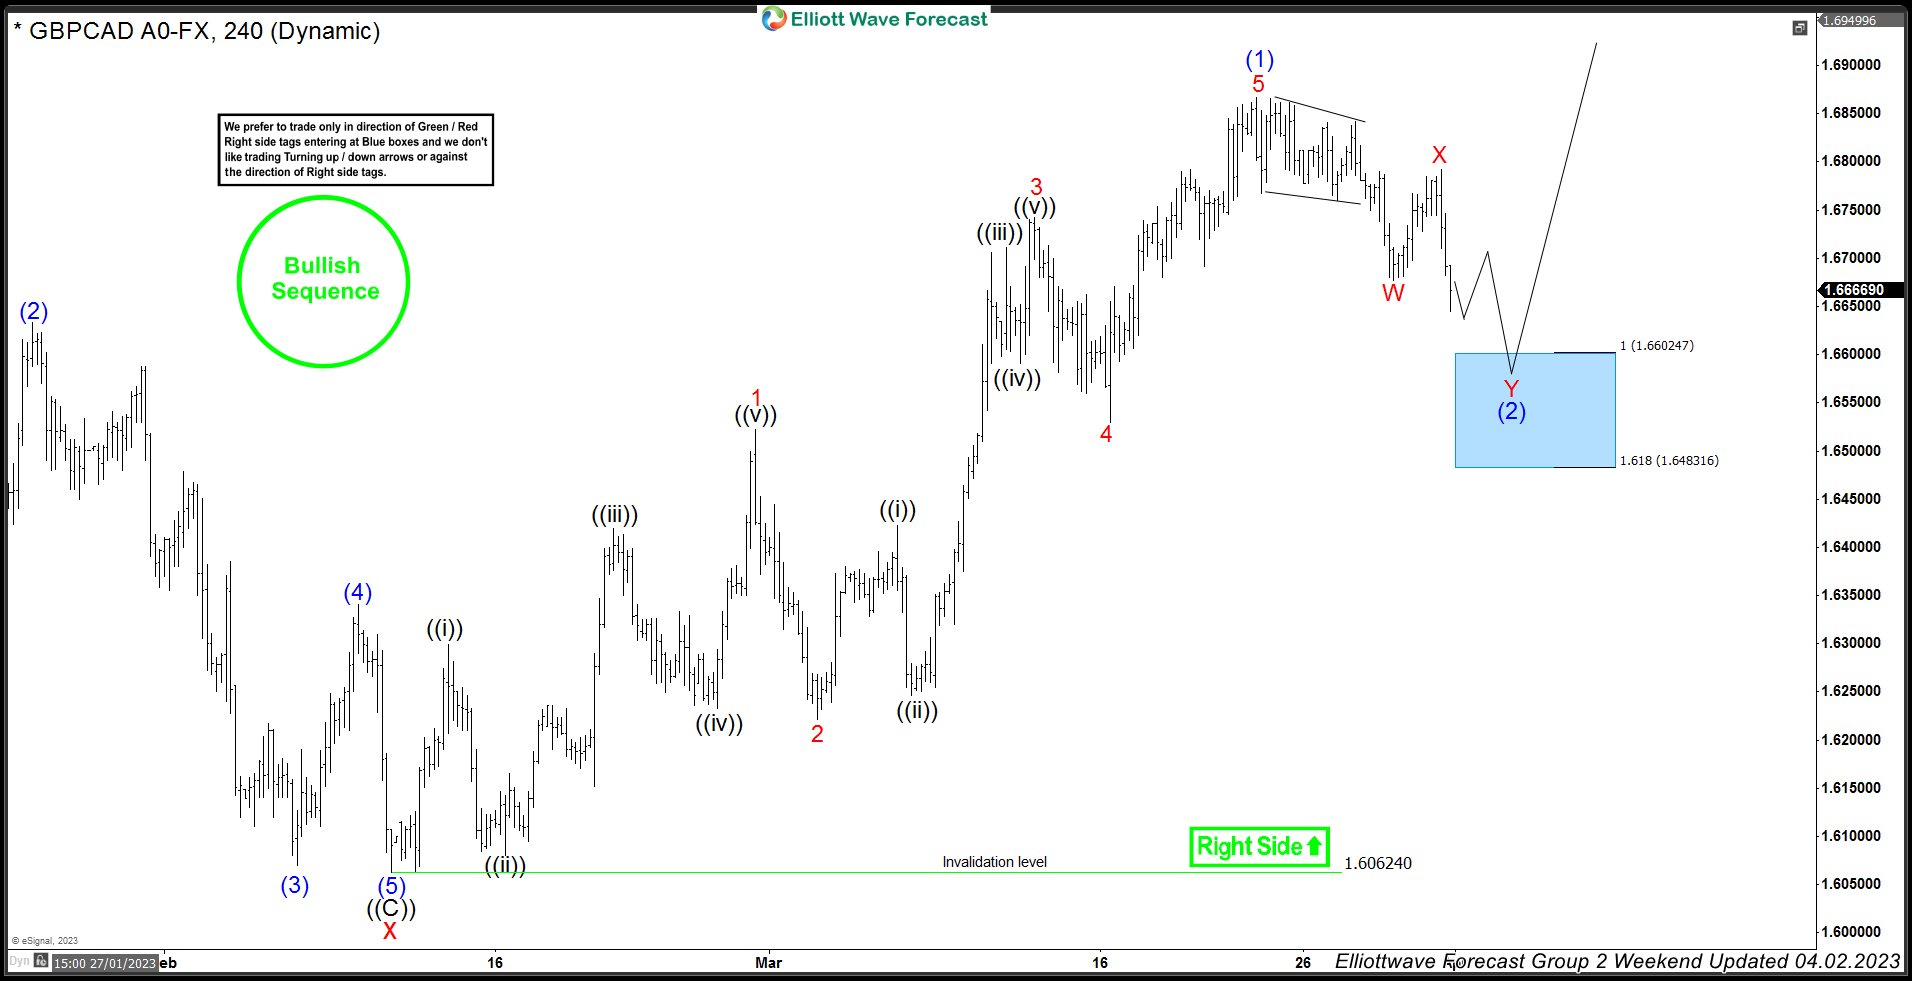
GBPCAD Touched The Blue Box Area & Now Turning Higher
Read MoreIn this technical blog, we will look at the past performance of the 4-hour Elliott Wave Charts of GBPCAD. In which, the rally from the 10 February 2023 low unfolded as an impulse sequence and showed a higher high sequence with a bullish sequence stamp. Therefore, we knew that the structure in GBPCAD is incomplete to the […]
-
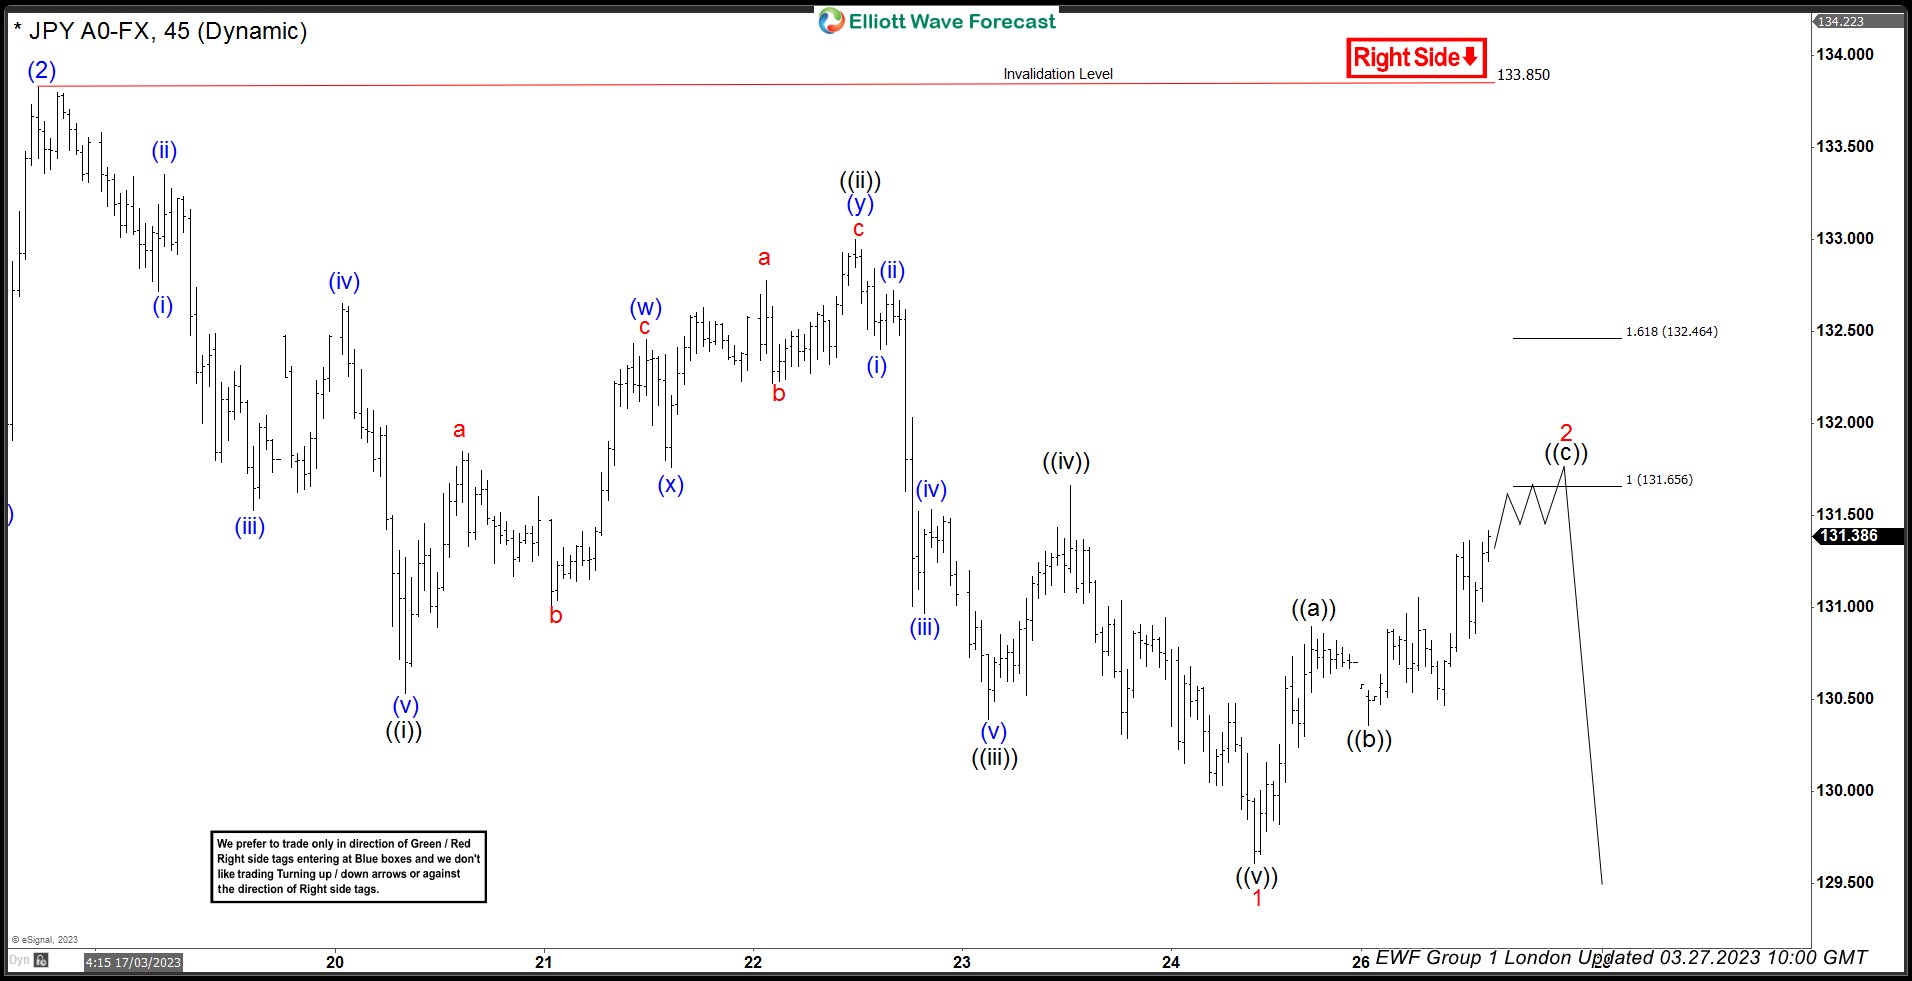
USDJPY Reacting Lower From The Equal Legs Area
Read MoreIn this technical blog, we will look at the past performance of the 1-hour Elliott Wave Charts of USDJPY. In which, the decline from 16 March 2023 high ended 5 waves in an impulse sequence and showed a lower low sequence in a higher time frame charts. Therefore, we knew that the structure in USDJPY […]