
-

XAUAUD Elliott Wave Analysis
Read MoreXAUAUD rallied from 2008 – 2011 followed by a pull back to 50 – 61.8 Fibonacci retracement zone in 2013. Since then it has been rallying again and now showing 5 swings up fro 2013 low which is in an incomplete sequence and make the instrument bullish against December 2015 low (1434) in first degree […]
-
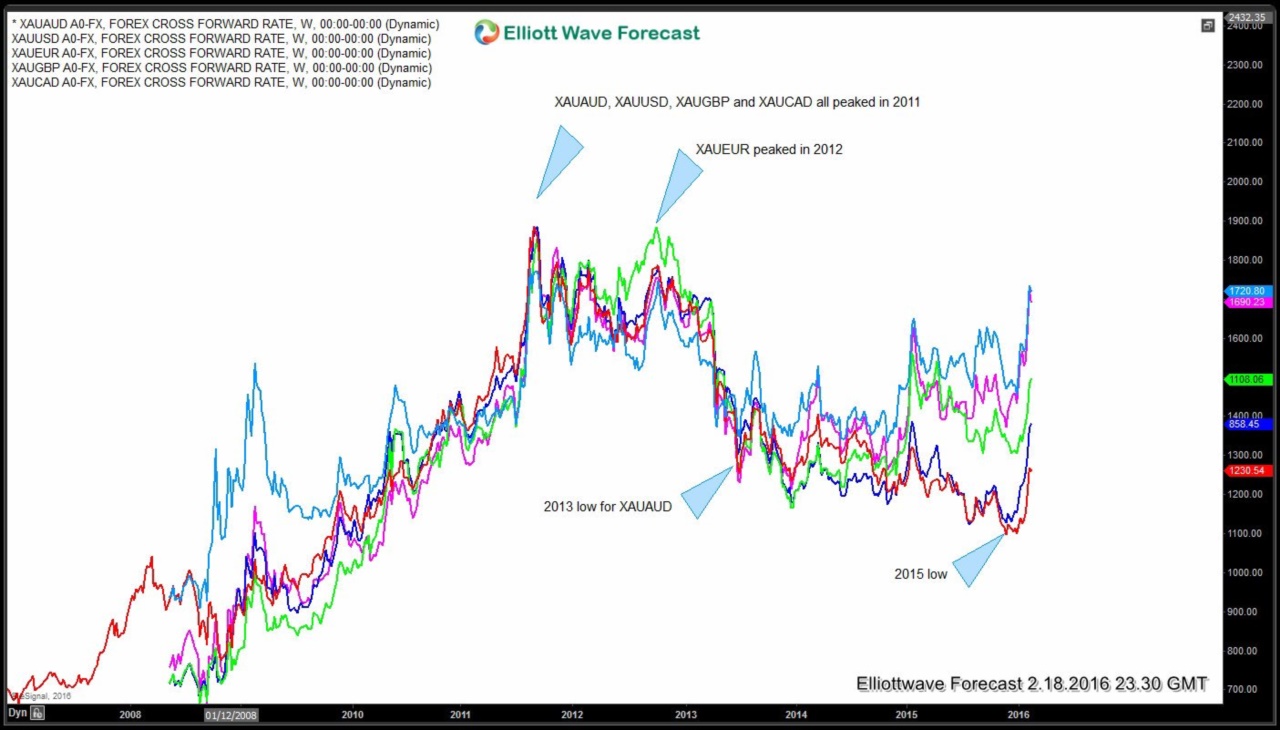
Gold: Will the rally extend or fail?
Read MoreGold (XAU) formed a peak against most major world currencies in 2011. This included XAUAUD, XAUUSD, XAUGBP and XAUCAD while XAUEUR peaked a little later in 2012. This was an important peak and resulted in a few years of downward price action in Gold against all major World currencies. Since December 2015, Gold has been rallying […]
-

CL_F: How we called the break of 26.19 low
Read MoreIn this video we take a look at the Weeky chart of Crude Oil and in particular the decline from 2011 and 2013 peaks. Structure of the decline from 2011 peak is a FLAT which is a 3-3-5 structure. Wave “c” of an Elliott wave FLAT structure could be an impulse or an Ending Diagonal. […]
-
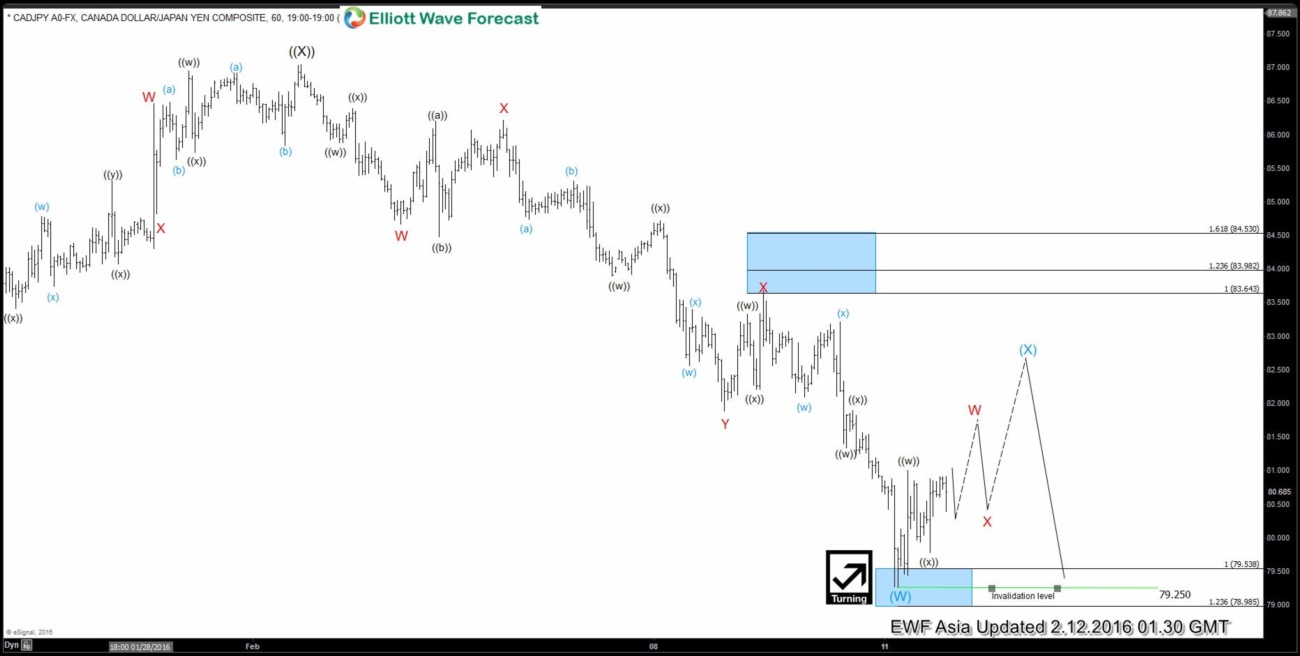
CADJPY Short-term Elliott Wave Analysis 2.12.2016
Read MoreShort term Elliottwave structure suggests wave ((X)) bounce ended at 87.06. Down from this level pair has enough number of swings in place to call a triple three structure completed at 79.25. As this level holds in the dips, pair has scope to put in a 3 or 7 swings bounce in wave (X) which is expected […]
-
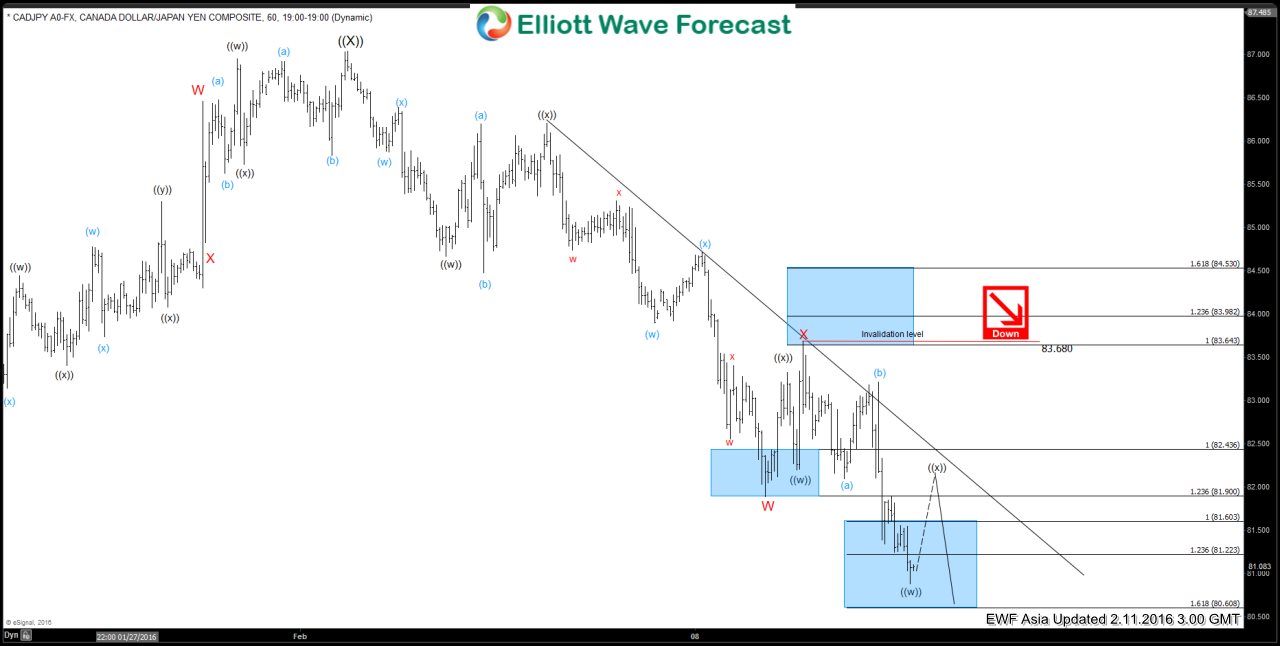
CADJPY Short-term Elliott Wave Analysis 2.11.2016
Read MoreShort term Elliottwave structure suggests wave ((X)) bounce ended at 87.06. Down from this level pair is showing 5 swings down and hence an incomplete sequence, therefore, we like the idea of bounces to fail below 83.68 high for another extension lower. Ideal target on the downside would be 78.54 – 77.32 but we would look […]
-
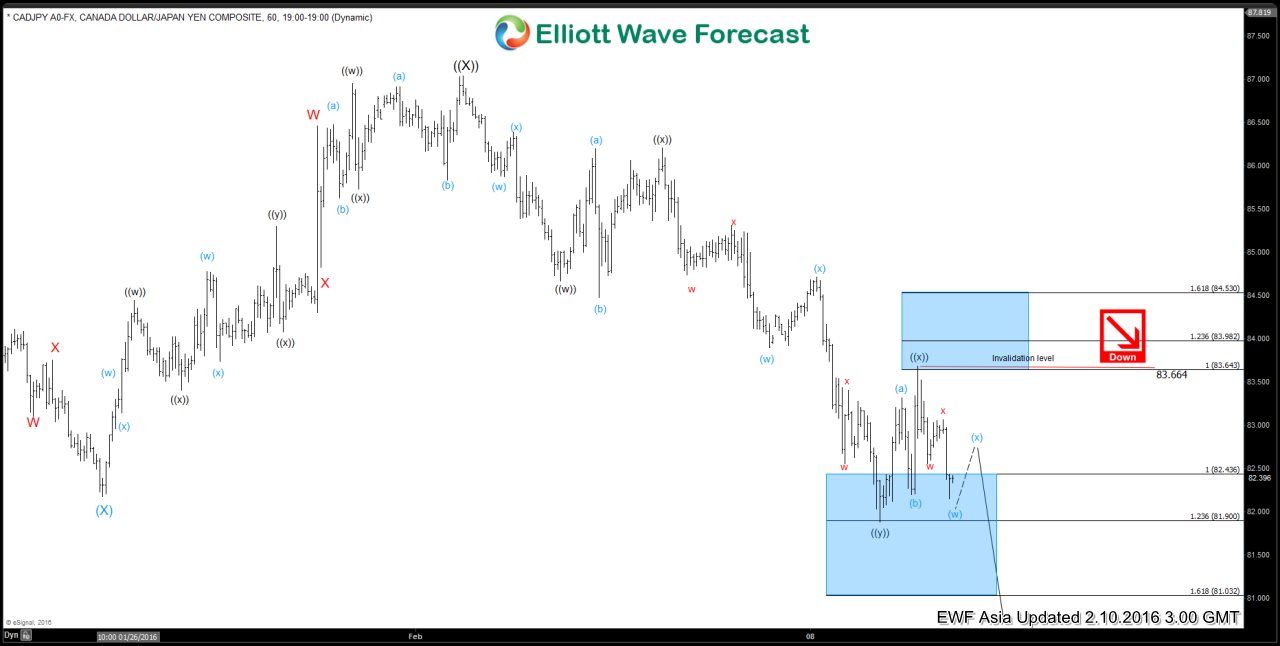
CADJPY Short-term Elliott Wave Analysis 2.10.2016
Read MoreShort term Elliottwave structure suggests wave ((X)) bounce ended at 87.06. From this level, pair turned lower in a triple three structure where wave ((w)) ended at 84.67, wave ((x)) FLAT ended at 86.2, wave ((y)) ended at 81.89 and a bounce in 2nd wave ((x)) is also proposed to be over at 83.66. While below 83.66 […]