Nasdaq futures rallied strongly since April 7, 2025 low and made a new all time high. Today, we take a look at how our members knew where the rally was likely to end and where we could start a rally for new all time highs or produce 3 waves reaction higher at least.
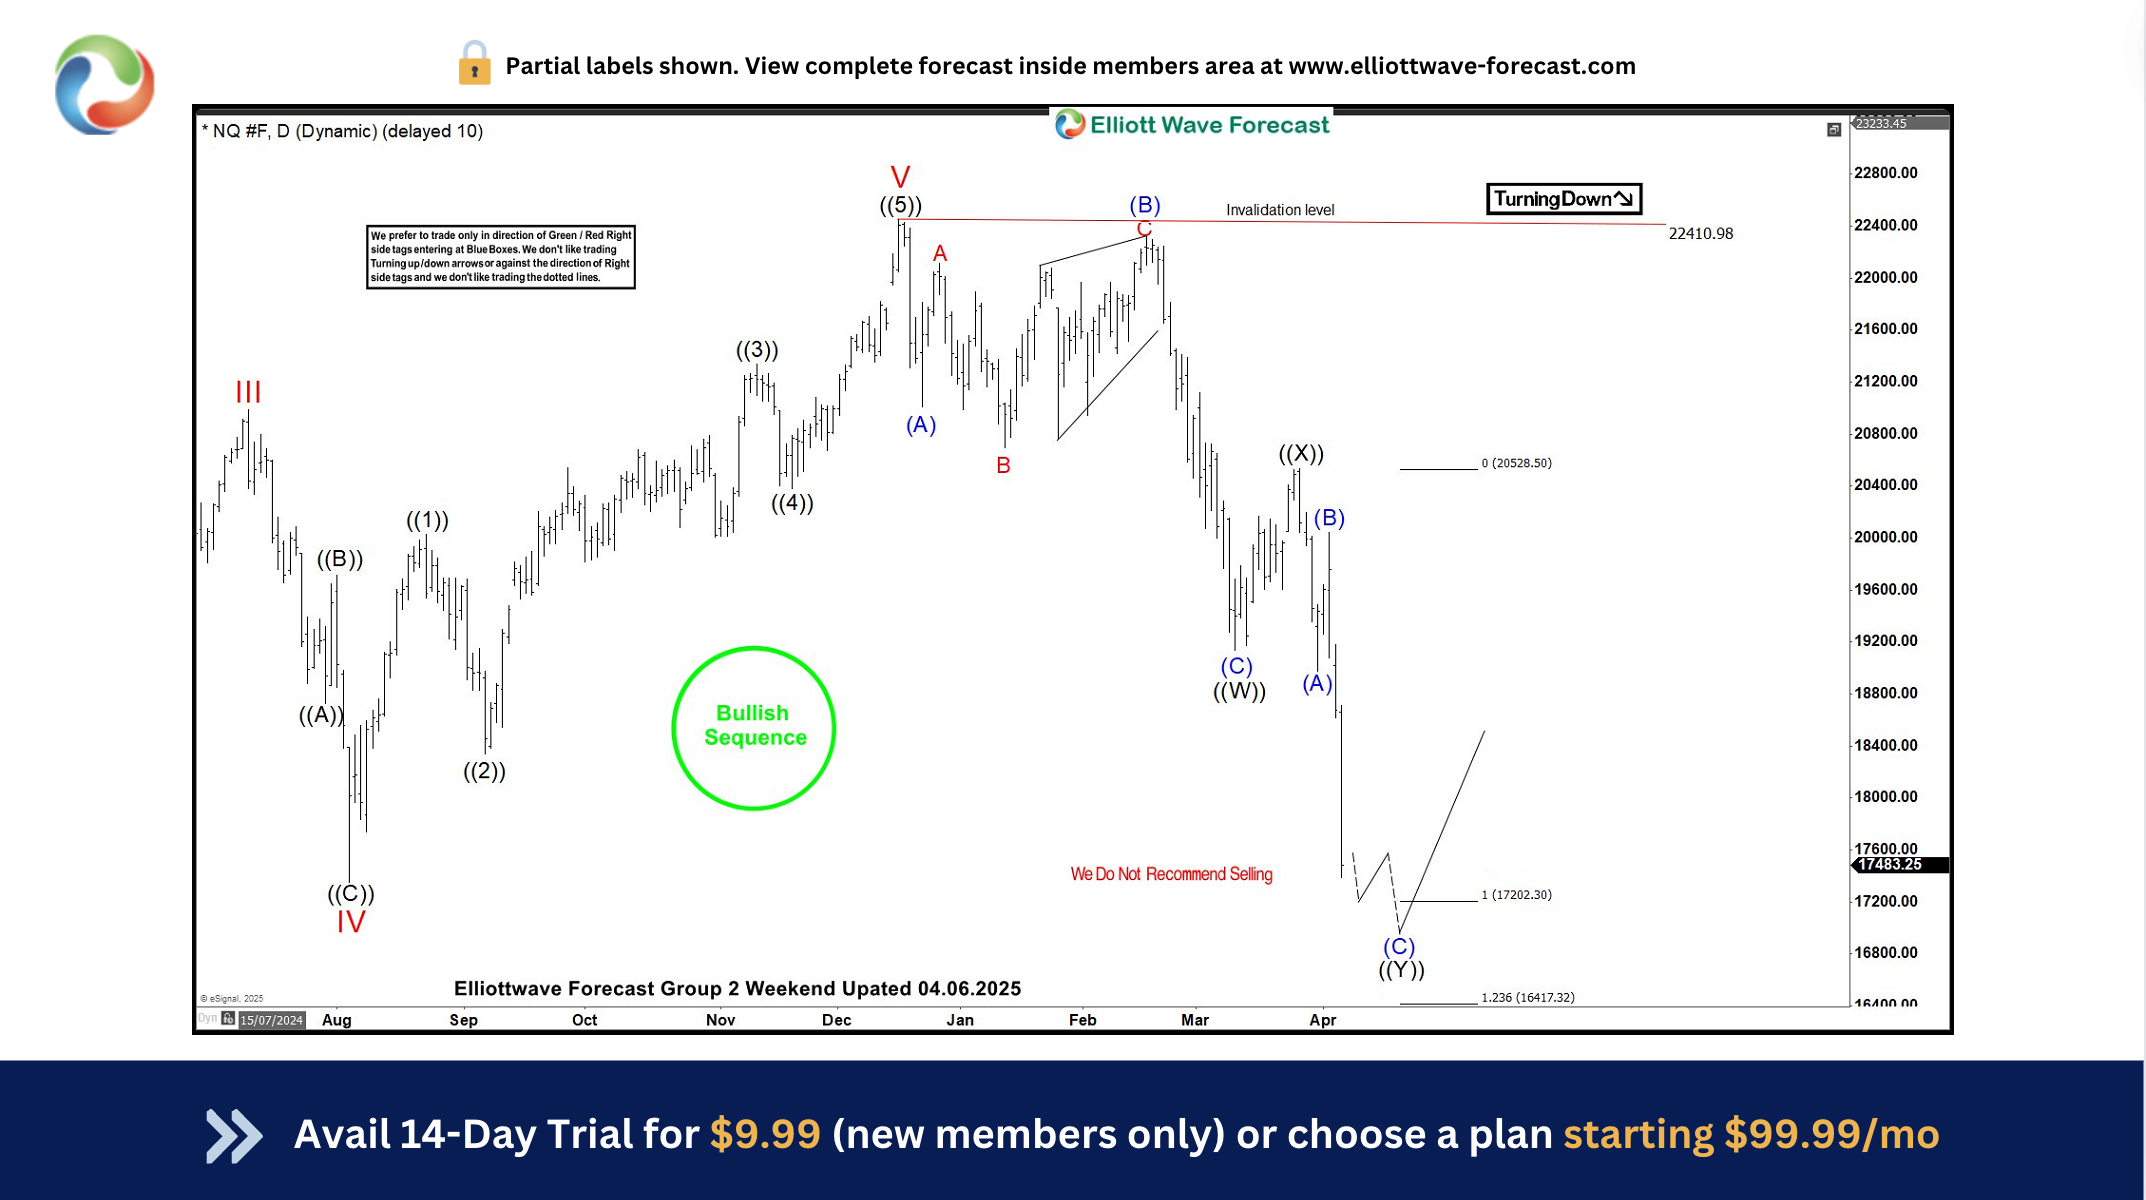
NQ_F (Nasdaq Futures) Daily Chart April 6, 2025
Nasdaq daily chart below shows Index futures ended cycle from October 2022 low back in December 2024. It was a tremendous rally which resulted in more than 100% gain. Pull back from December 2024 high is in 3 waves or 7 swings and should be ending between 17202 – 16417 area. As pull back holds above 14375 which is 161.8% fibonnacci extension of (( W )) related to (( X )), we expect Index futures to find buyers in 17202 – 16417 area and turn higher to resume the rally for a new all time high.
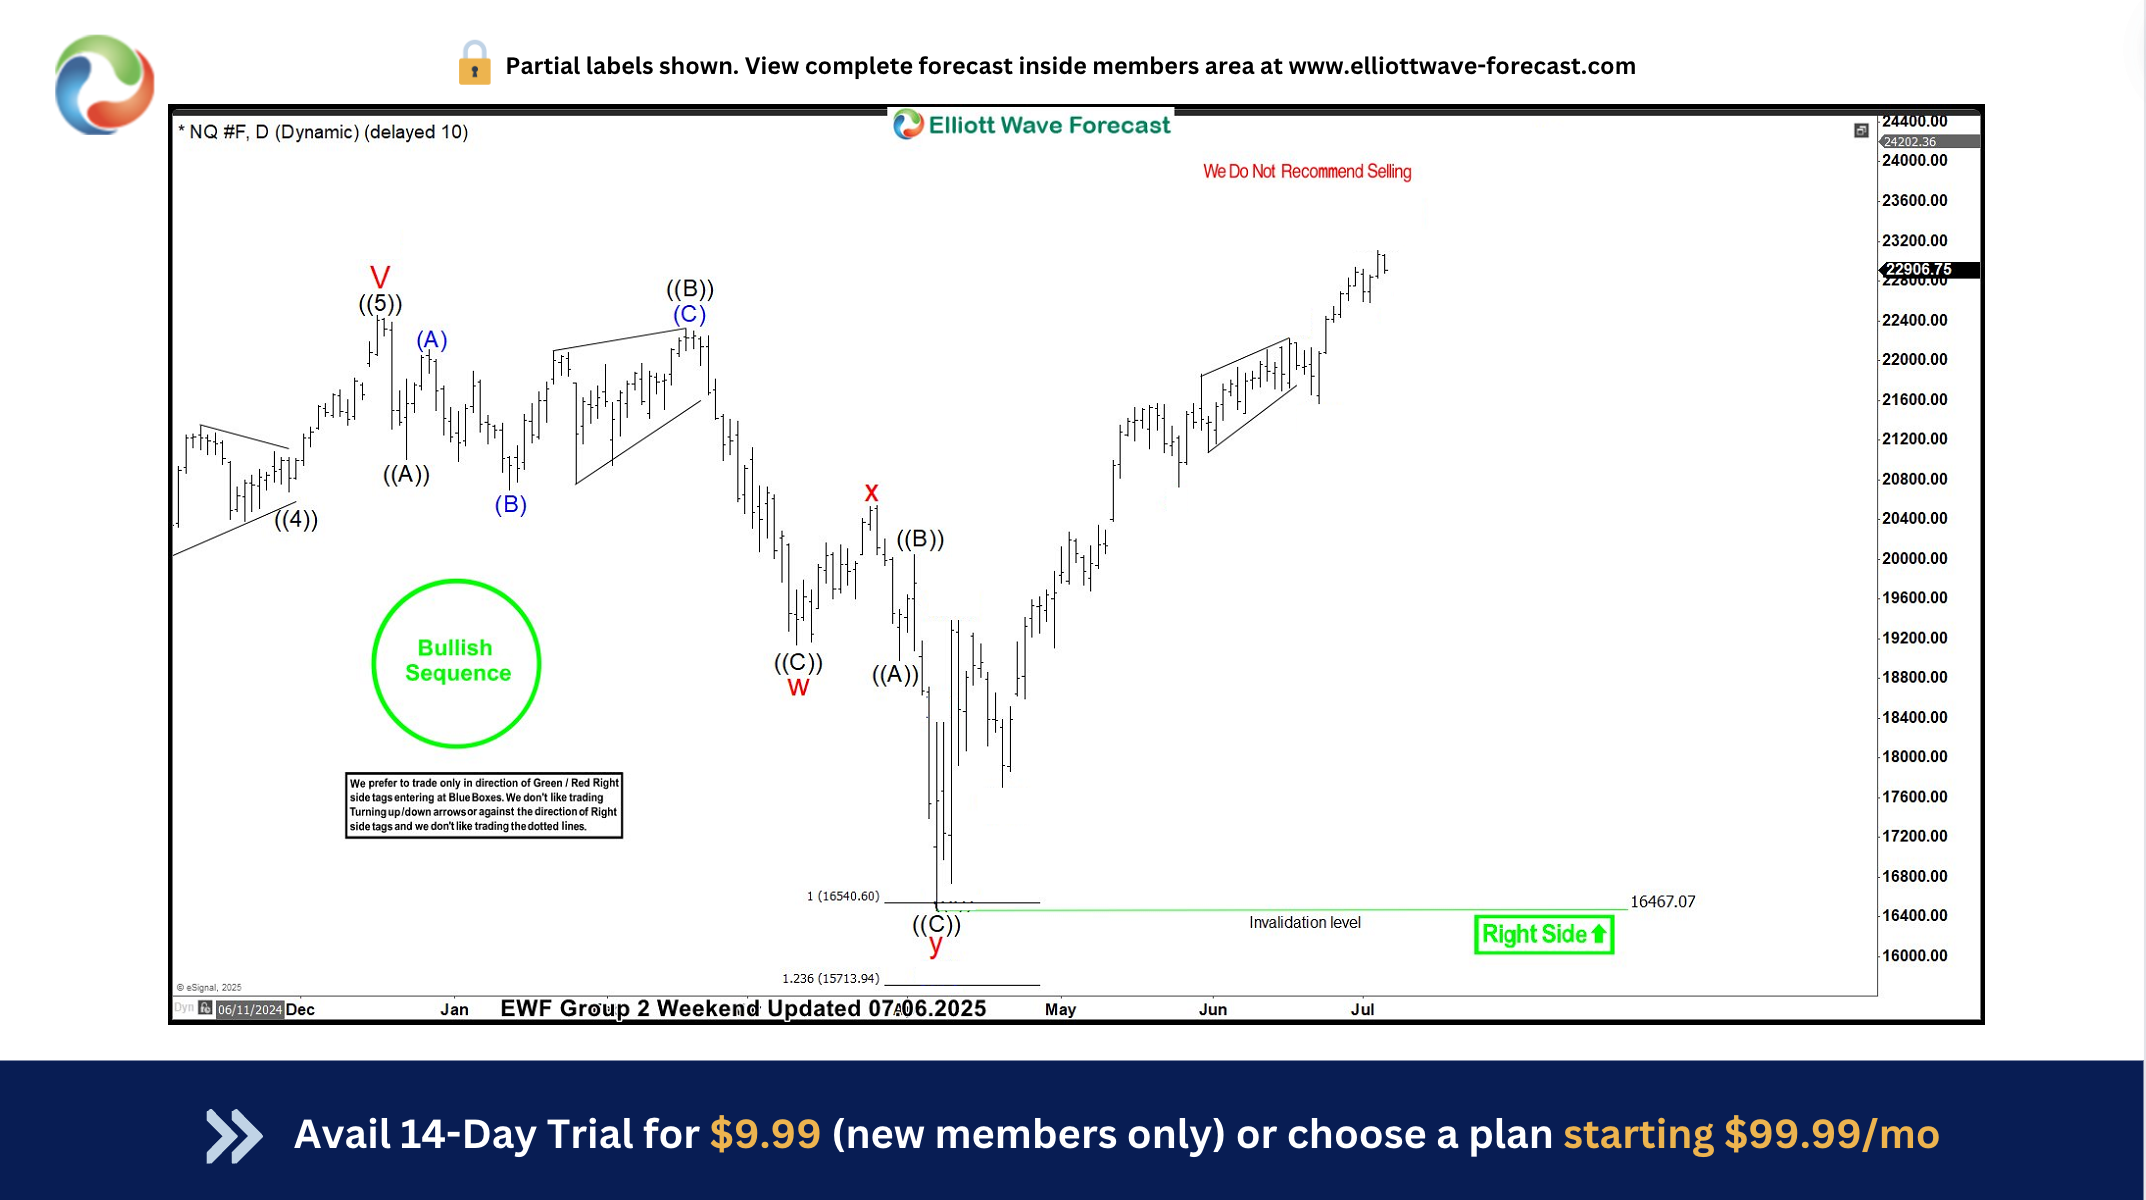
NQ_F (Nasdaq Futures) Daily Chart April 6, 2025
Nasdaq futures completed 7 swings in the defined area finding a low at 16467 and rallied strongly. Index made a new all time within a few months of hitting the buying area. It rallied from 16467 to 22998 gaining 6531 points which works out to be 39.66%. When market was in a sharp decline back in April 2025, our members knew exactly where to expect the pull back to end and to enter long positions. It has yielded a profit of 39.66% so far and rally is not over yet. Rally from April 2025 low can extend further before it comes to an end. Once the rally is over, we can expect a larger pull back in 3 or 7 swings to correct the cycle from April 2025 low before Index futures turn higher again.
In order to stay on top of the market moves and access more such trading opportunities, join us here.


