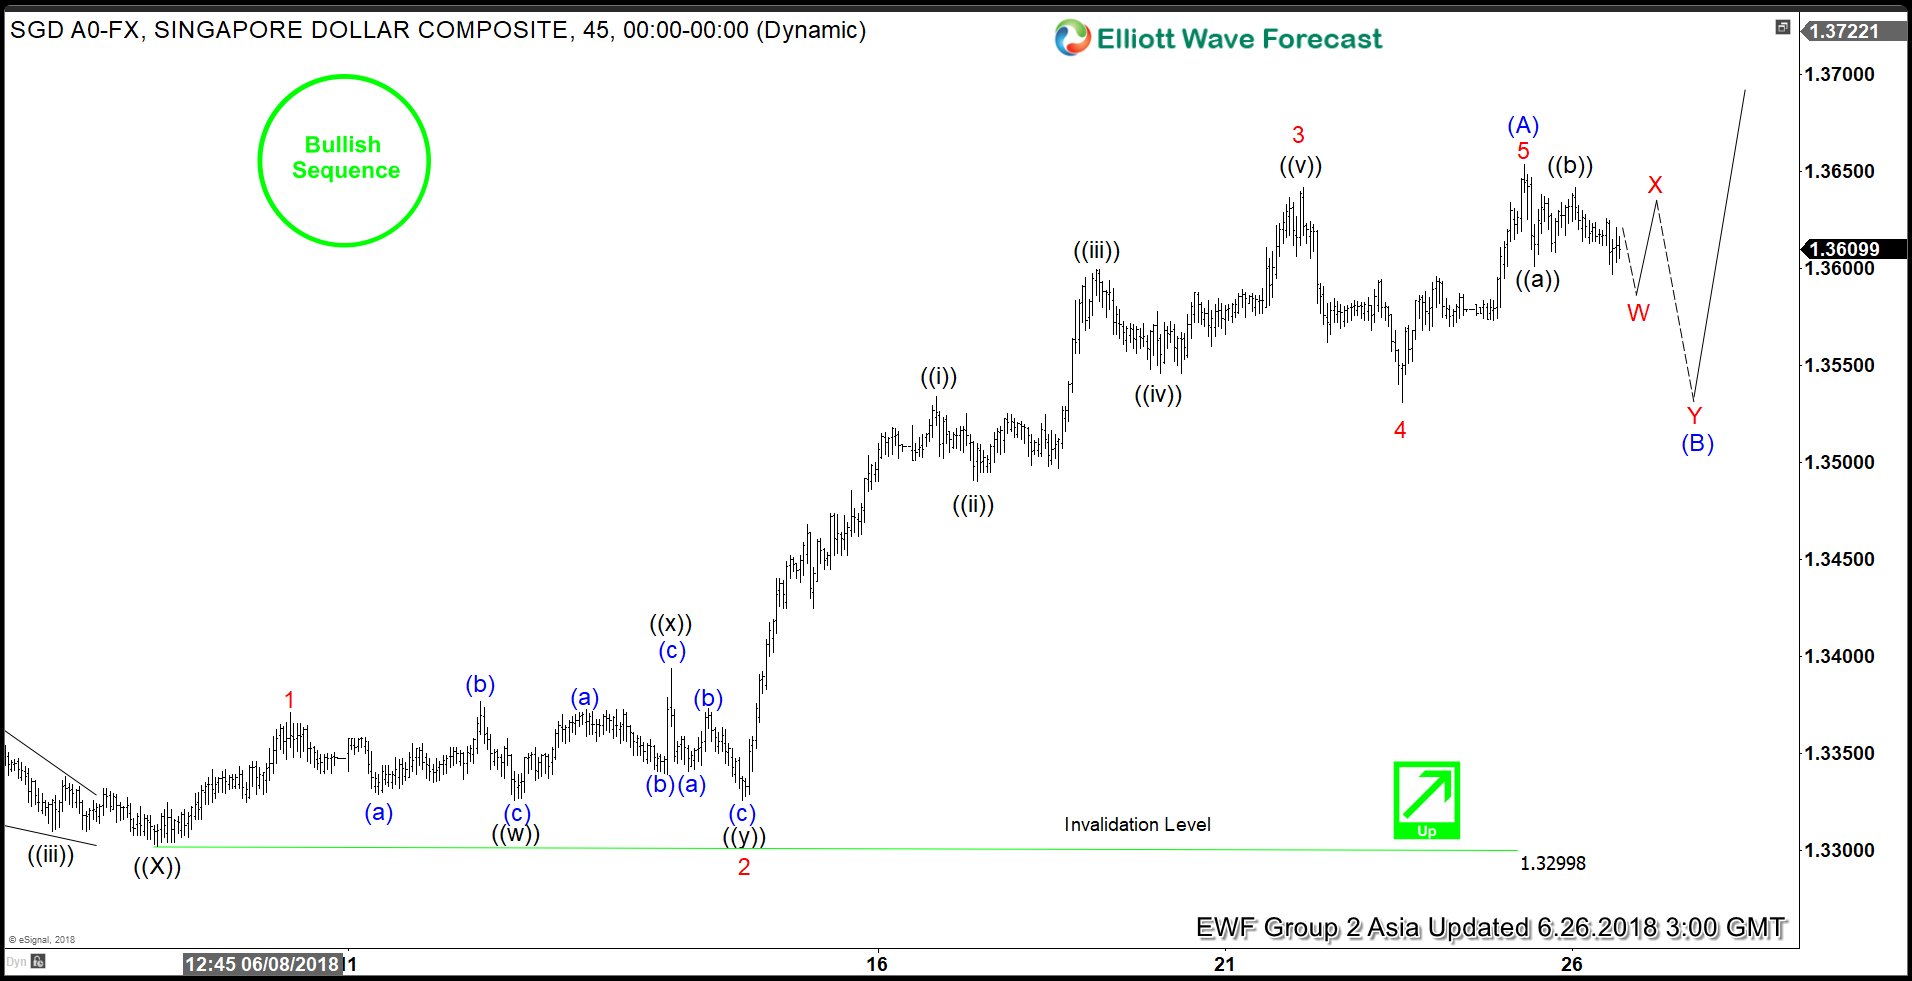
USDSGD short-term Elliott wave view suggests that the decline to 1.3299 on 6/07 low ended primary wave ((X)) pullback. Above from there, the pair rallied higher and went on to make a new high for this year creating 5 swing incomplete sequence to the upside from 1/25/2018 low. This sequence is represented by the bullish tag marked on the chart below.
The rally from 6/07 low appears to be in 5 waves & the structure looks impulsive. The 5 waves rally up from 6/7 low ended Intermediate wave (A) of an Elliott wave Zig-zag pattern at 1.3654. Up from Primary wave ((X)) low at 1.3299, the rally to 1.3371 high ended Minor wave 1. Then the pullback to 1.3326 low ended Minor wave 2 as double three structure.
Above from there, the pair made a strong rally in lesser degree 5 waves structure & ended Minor wave 3 at 1.3642 high. Down from there, the pullback to 1.3531 low ended Minor wave 4. Finally, the rally to 1.3654 high may have ended Minor wave 5 and also the Intermediate wave (A) of a Zigzag. The pair is now doing a pullback in Intermediate wave (B) to correct cycle from 6/07 low in 3, 7 or 11 swings before further upside is seen. We don’t like selling it and expect buyers to appear once Intermediate wave (B) pullback ends in 3, 7 or 11 swings for further upside, provided the pivot from 6/07 low (1.3299) stays intact.
USDSGD 1 Hour Elliott Wave Chart
Currently we’re running special promotion for new members, giving 2 Months for the price of 1. Sign up at the banner below.


