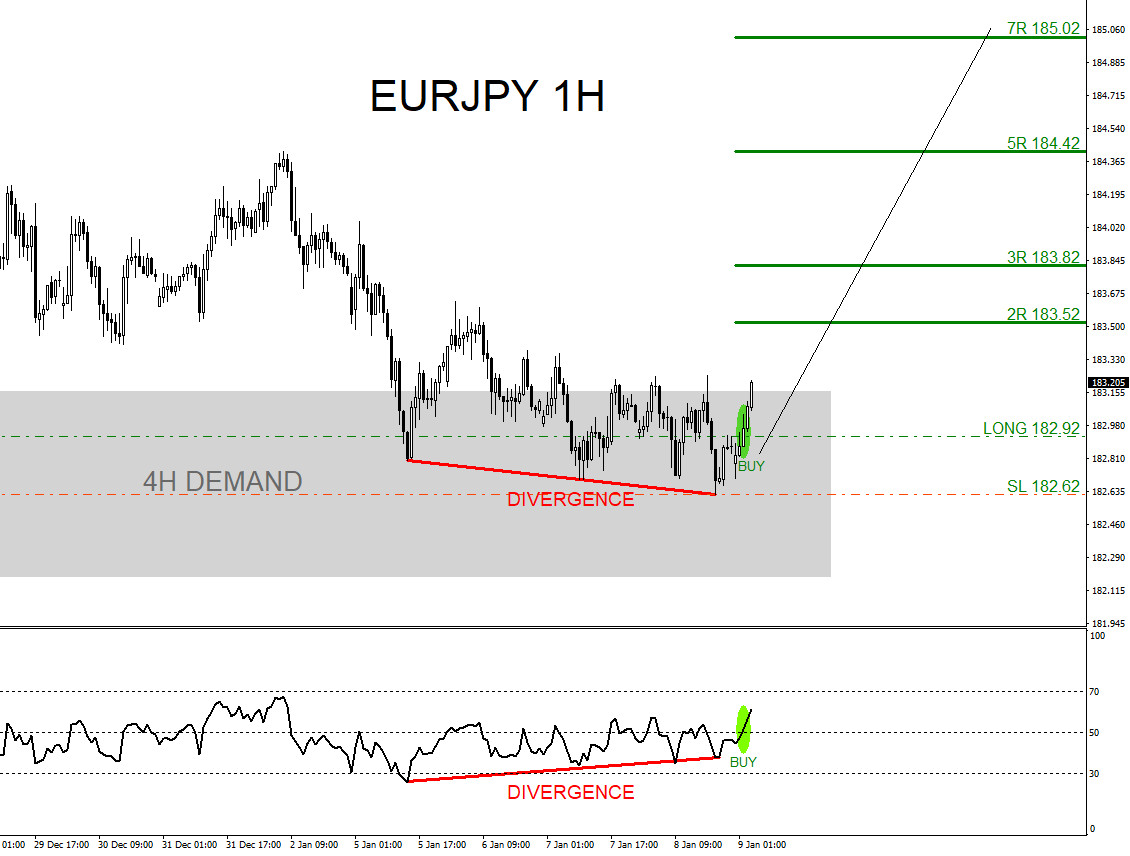
On January 8 2026 I posted on social media @AidanFX the EURJPY buy setup chart with stop loss and targets.
When the EURJPY pair made a pullback to the 4 hour demand zone (Gray) and stalled in this zone I entered the buy trade with a 30 pip stop loss and a maximum take profit target at the 7R 185.02.
Added confirmation for the buy entry was the bullish divergence pattern (Red) which formed in the demand zone and RSI indicator printing above the 50 level (Green).
EURJPY 1 Hour Chart January 8 2026
EURJPY 1 Hour Chart January 12 2026
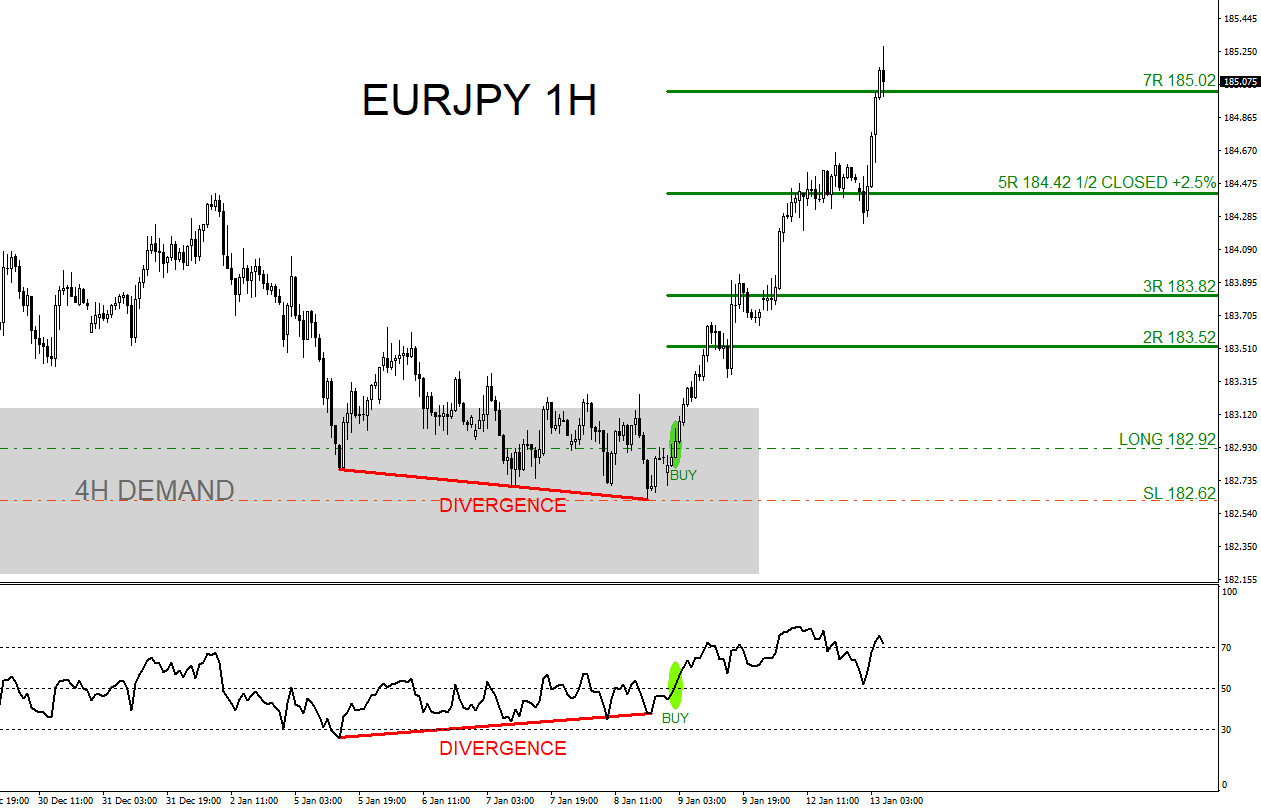
EURJPY moves higher and hits 5R target at 184.42 where I closed 1/2 the position for +2.5% profit gain.
The pair continues higher and on January 12 2026 EURJPY tags the 7R target at 185.02 where I closed the remaining 1/2 position for another +3.5% gain.
Combined total was a +6% profit gain. (Risking 1% on every trade)
A trader should always have multiple strategies all lined up before entering a trade. Never trade off one simple strategy. When multiple strategies all line up it allows a trader to see a clearer trade setup.
We at EWF never say we are always right. No market service provider can forecast markets with 100% accuracy. Only thing we at EWF 100%, is that we are RIGHT more than we are WRONG.
Of course, like any strategy/technique, there will be times when the strategy/technique fails so proper money/risk management should always be used on every trade.
Hope you enjoyed this article and follow me on social media for updates and questions> @AidanFX
At Elliottwave-Forecast we cover 78 instruments (Forex, Commodities, Indices, Cryptos, Stocks and ETFs) in 4 different time frames and we offer 5 Live Session Webinars everyday. We do Daily Technical Videos, Elliott Wave Trade Setup Videos and we have a 24 Hour Chat Room. Our clients are always in the loop for the next market move.
Try Elliottwave-Forecast for 14 days !!! Just click here –> 14 day trial


