$XLP 4H Elliott Wave Chart 12.20.2023:
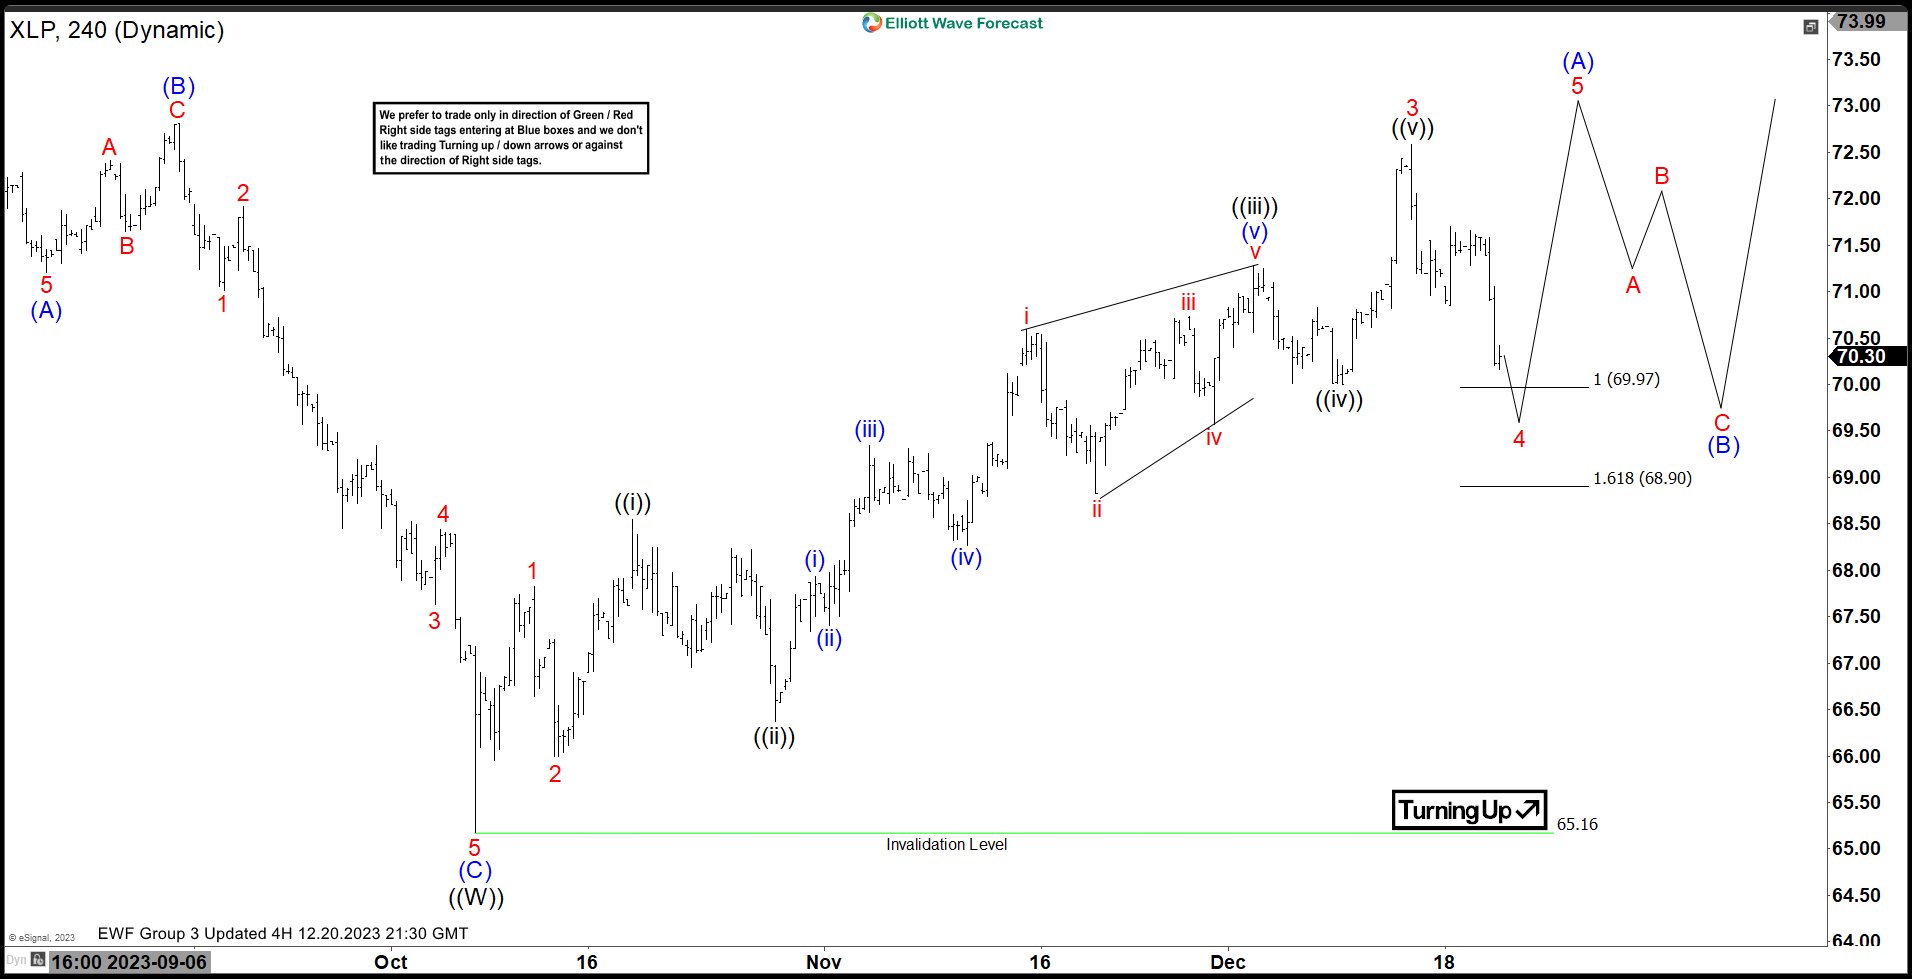 Here is the 4H Elliott Wave count from 12.20.2023. We expected the pullback to find buyers at red 4 in a 3 swing structure (ABC) at 69.97 – 68.90.
$XLP 4H Elliott Wave Chart 12.24.2023:
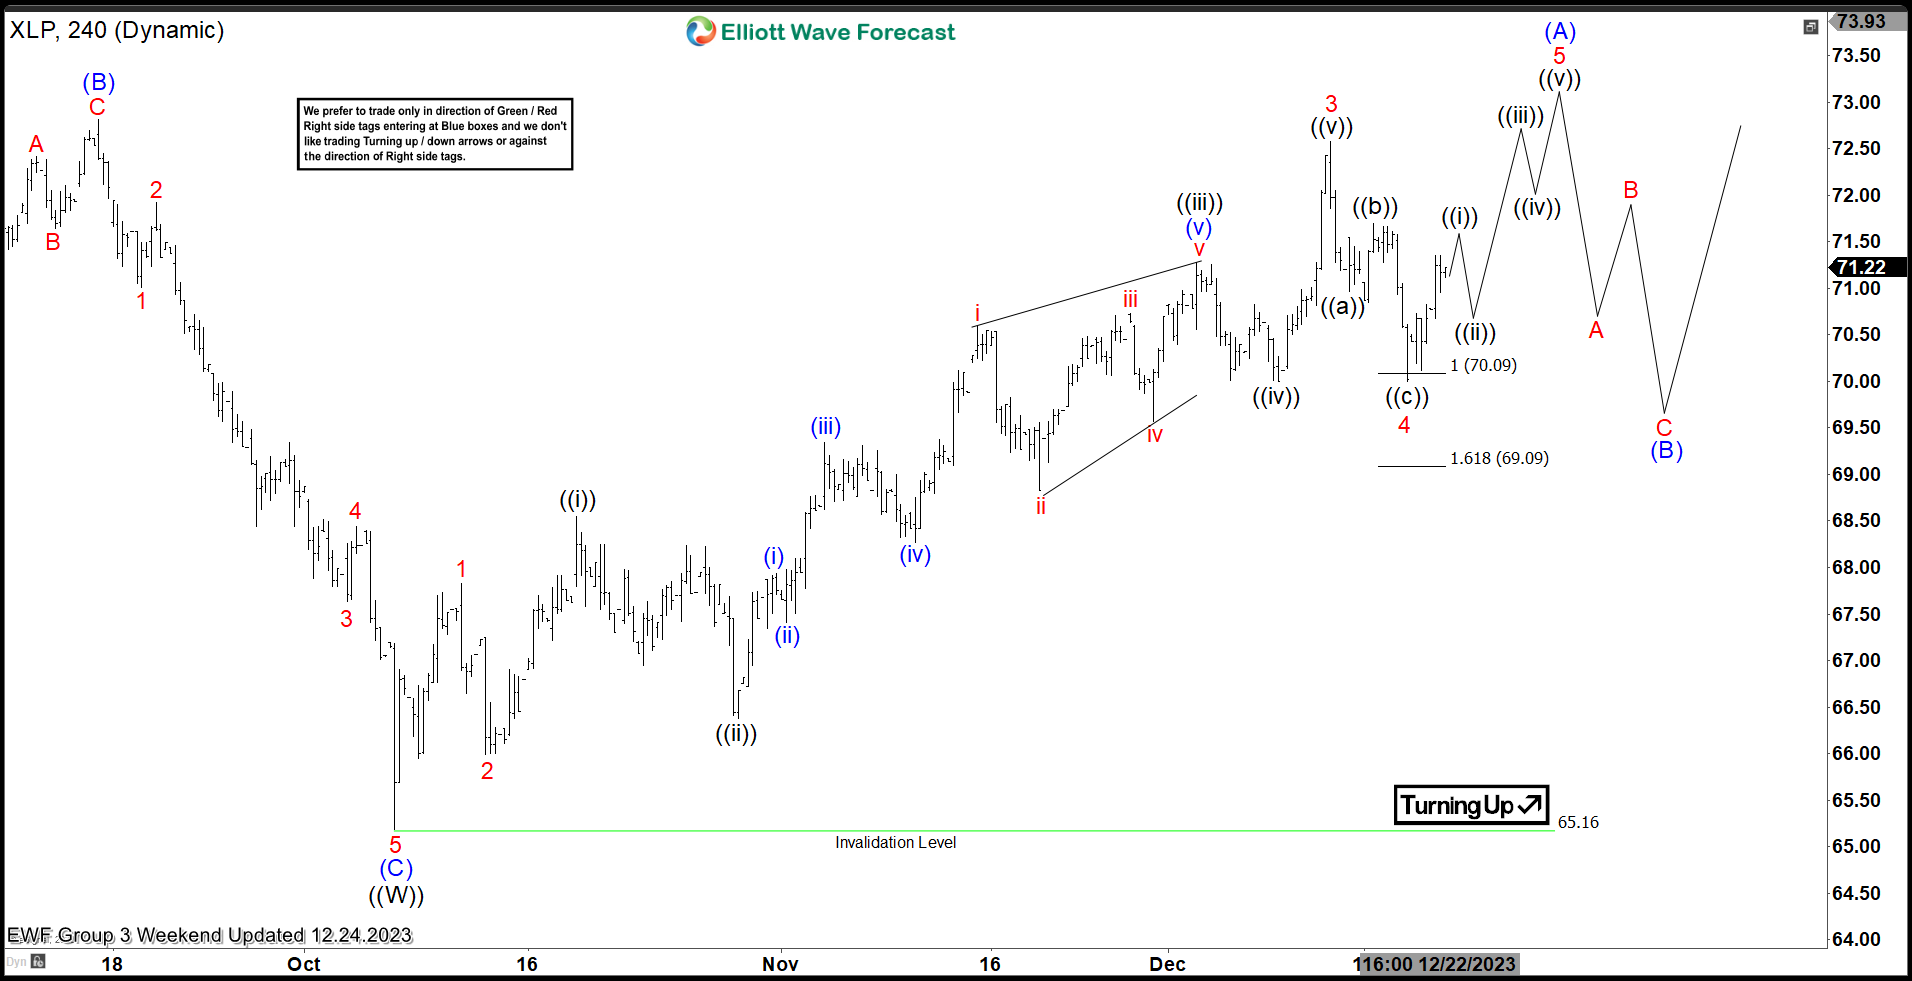 Here is the latest 4H update showing the bounce taking place as expected. The ETF reacted higher after reaching the extreme area allowing longs to get a risk free position. We expect the ETF to continue higher towards $73.19 – 74.15 before a pullback can happen.
Elliott Wave Forecast
We cover 78 instruments, but not every chart is a trading recommendation. We present Official Trading Recommendations in the Live Trading Room. If not a member yet, Sign Up for Free 14 days Trial now and get access to new trading opportunities.
Welcome to Elliott Wave Forecast!


