Elliott Wave Forecast is a technique to forecast the market based on Elliott Wave Principle which was develop around 1930’s and since then many traders have been following the theory and applying it in their everyday trading. We all know life is not perfect and nothing is 100% accurate, same applies to the Elliott wave Theory. We have been trying over the last 11 years to take away the subjective nature of the Theory.
The Main thing is that the Theory fails in many aspects and we need to keep in mind that it was developed based on Indexes which don’t trade the same way as some of the other markets for example Commodities or Forex. The big difference is the Trend, every Professional trader knows that Indexes trend while on the other hand the Commodities and Forex market tend to range more. This presents huge differences when it comes to applying the Elliott Wave Theory and executing trades based on the theory in these markets. There are a number of reasons why 95% of traders fail to become successful and give up trading and pick some other profession. Some of the major reasons are 1) Trading without a Plan 2) Poor Money Management and 3) Trading with a Poor Risk / Reward ratio. Also, new traders hear every one say Trend is your friend and trading in direction of the trend is the way to become a successful trader. However, many traders in general and new traders in particular don’t even know how to define a trend. This is where we believe a forecasting service has to play it’s part and make it absolutely clear to the traders what the trend is for each instrument in each time frame so they can filter out non-trending instruments when looking for an instrument to trade.
We at Elliott Wave Forecast take the stress away from traders and combine the concept of Trend with swings sequences and extreme areas to come up with high probability trade setups. We use Green (Up), Red (Down) and Turning (Black) arrows to indicate the Trend with a clear invalidation level in each time frame. Then, we use Green Bullish Sequence and Red Bearish sequence stamps where we see an incomplete Bullish or Bearish sequence in any time frame and then highlight extreme areas to buy or sell with a blue shaded box. In addition, we use solid lines to show a move in direction of the trend and a dotted line to represent a correction against the trend. We also put a lot of focus on Money / Risk Management and don’t advise our clients to Risk more than 1-2% of their equity on any trade and only pick trades with a Risk / Reward ratio of 2:1. We have made available this Position Size Calculator as well to help clients to determine the position size they should pick for their trades based on their equity and stop loss required for a particular trade.
We know trading is not an easy job and it’s hard to remember all the advice you get when you see a trade setup unfolding right in front of your eyes and / or when your entry order is about to get triggered so we put a text box with some key instructions about Trading Elliott Wave Forecast charts on most of our charts.
Rules for Trading Elliott Wave Forecast Charts
- Trade only charts with bullish or bearish sequence stamps
- Trade in 3, 7 or 11 swings in blue boxes
- Trade in direction of Red / Green arrows and solid lines
- Don’t Trade in direction of dotted lines
Now, let’s take a look at a couple of recent charts of Palladium
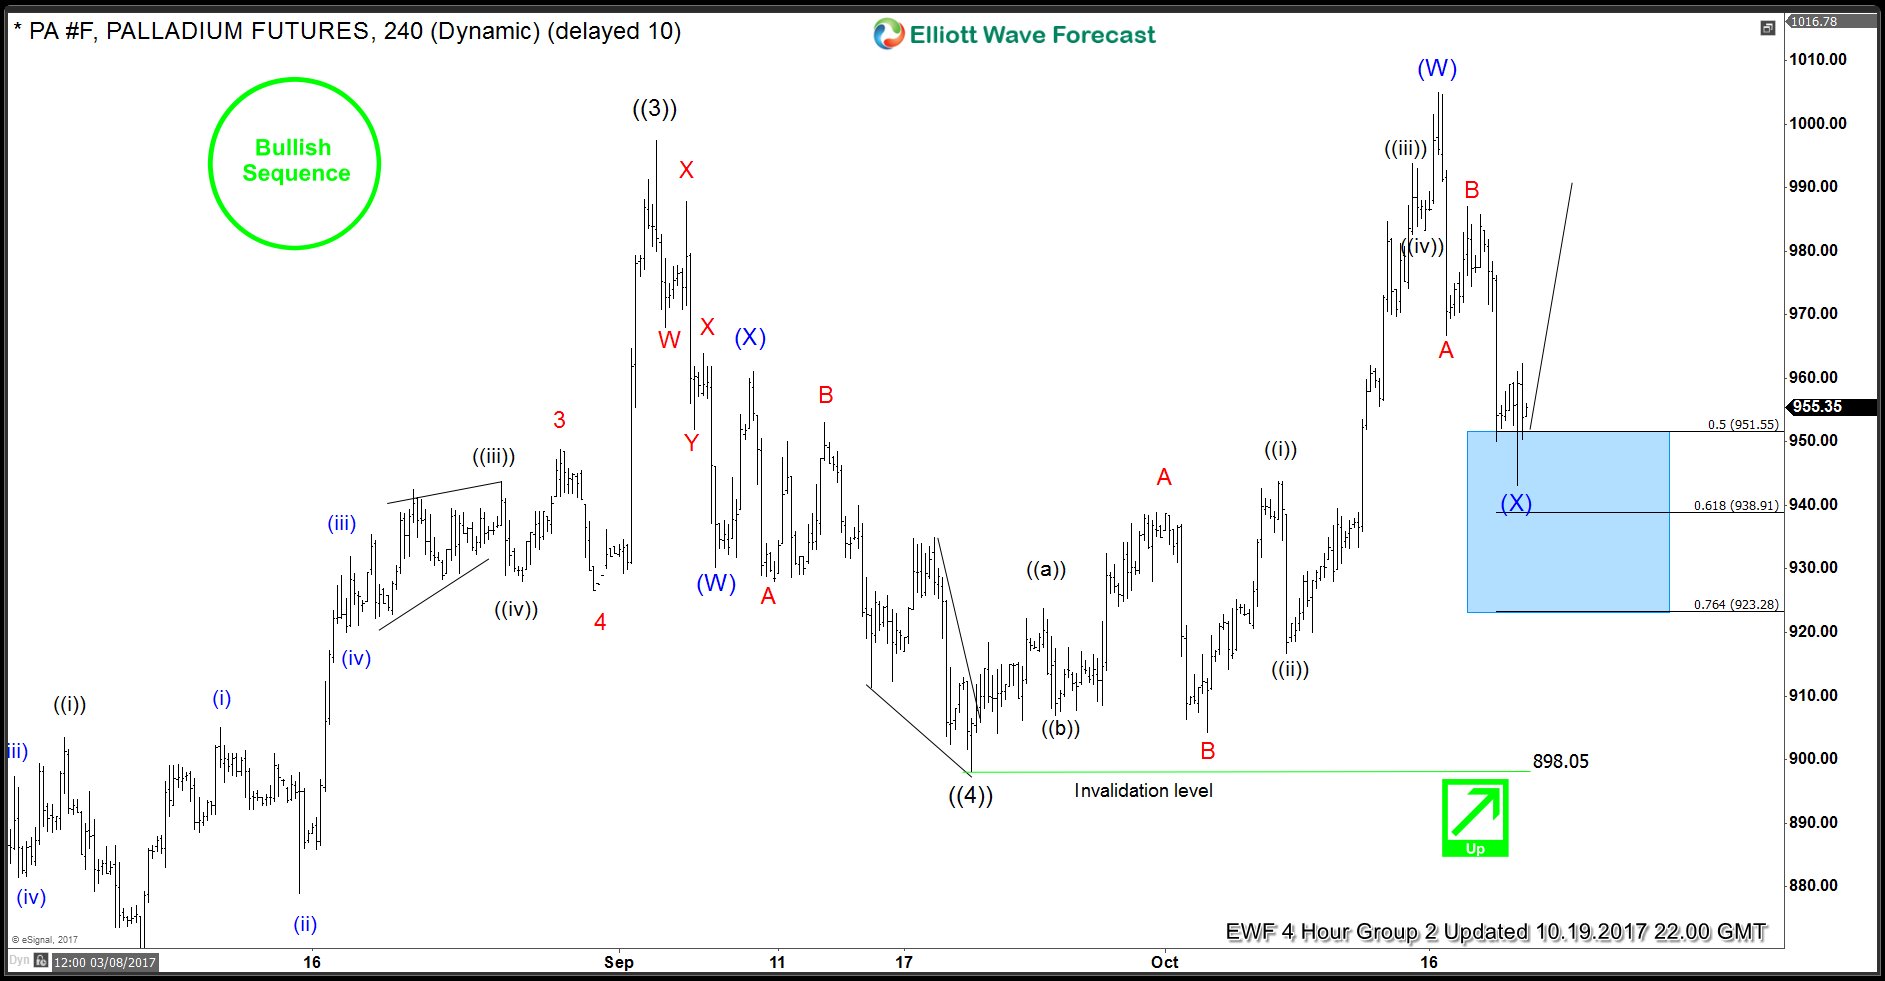
Palladium 4 Hour Elliott Wave Forecast 10/18/2017
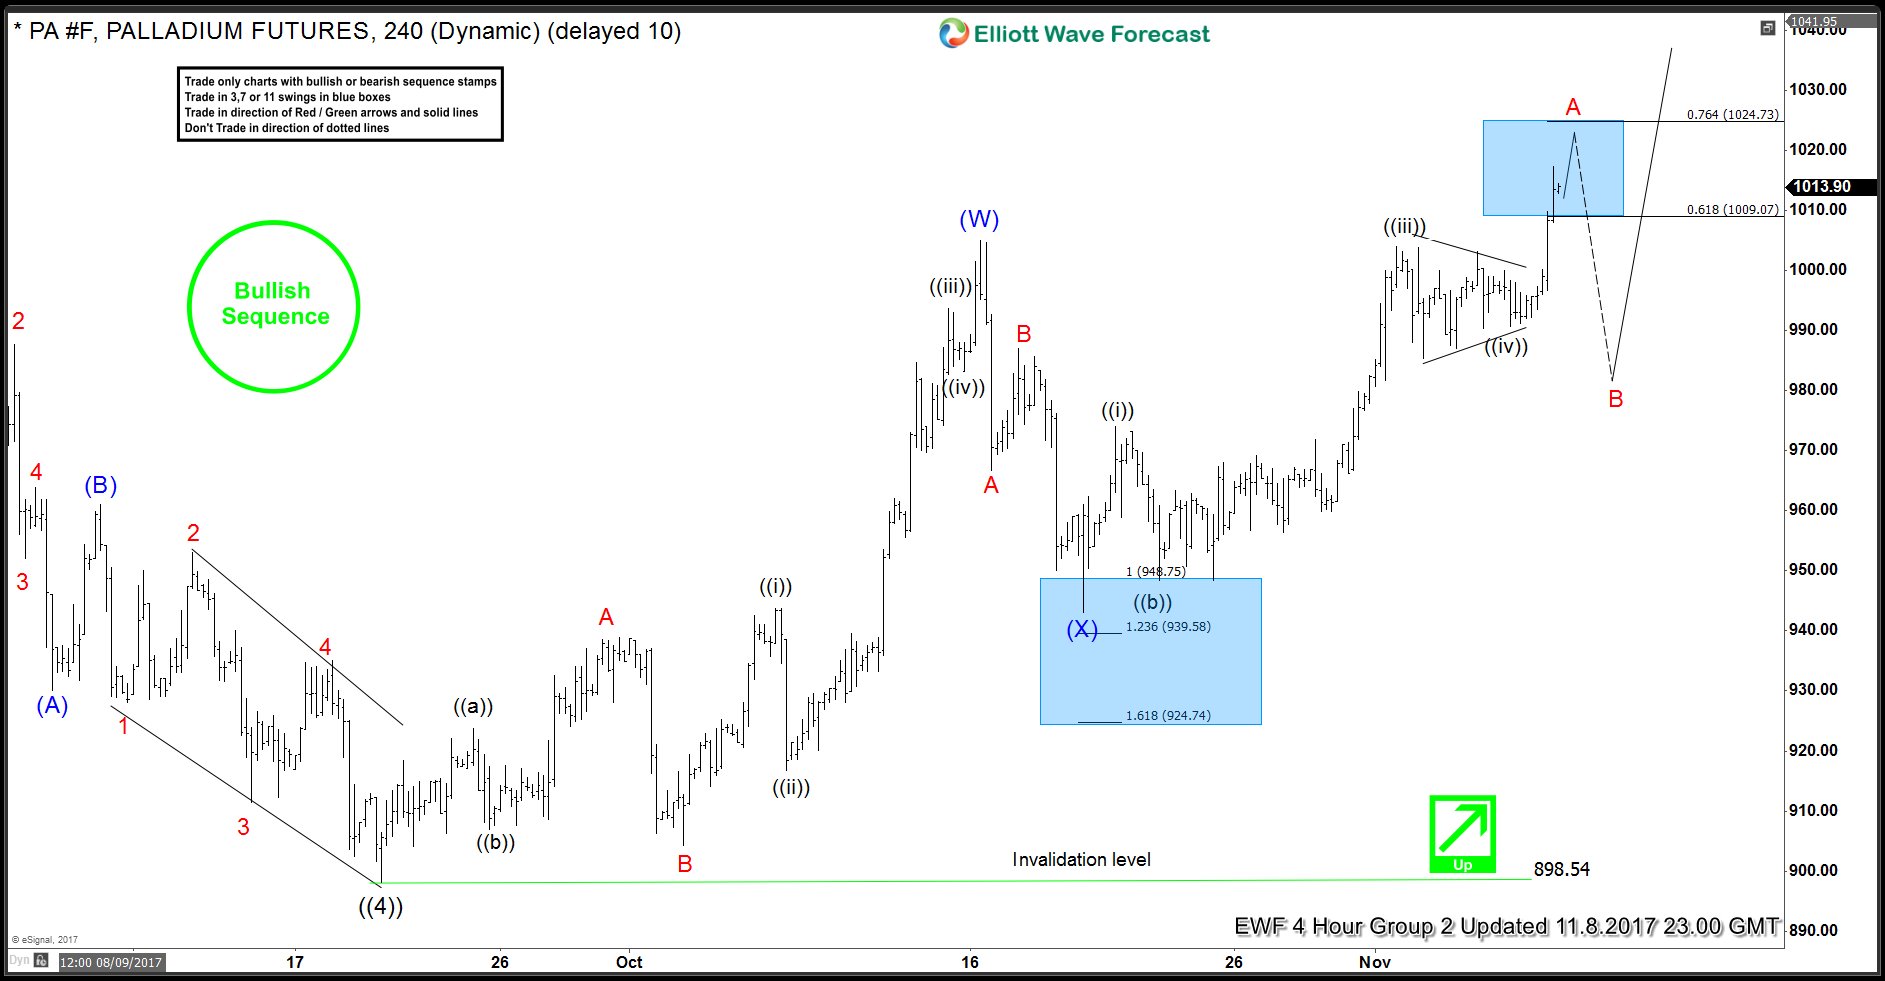
In the chart above, we can see there is a Green arrow to indicate the Trend is up, Bullish Sequence stamp to stay the Sequence is also bullish, we see a blue box which price has just tested and a solid line showing a move is expected higher so this chart is in line with all 4 rules that we posted above for a long trade. Our clients bought Palladium in the blue box and now let’s take a look at Palladium chart from 11/8/2017 to see the result.
Palladium 4 Hour Elliott Wave Forecast 11/8/2017
Now, let’s take a look at a couple of recent charts of CADJPY Forex pair
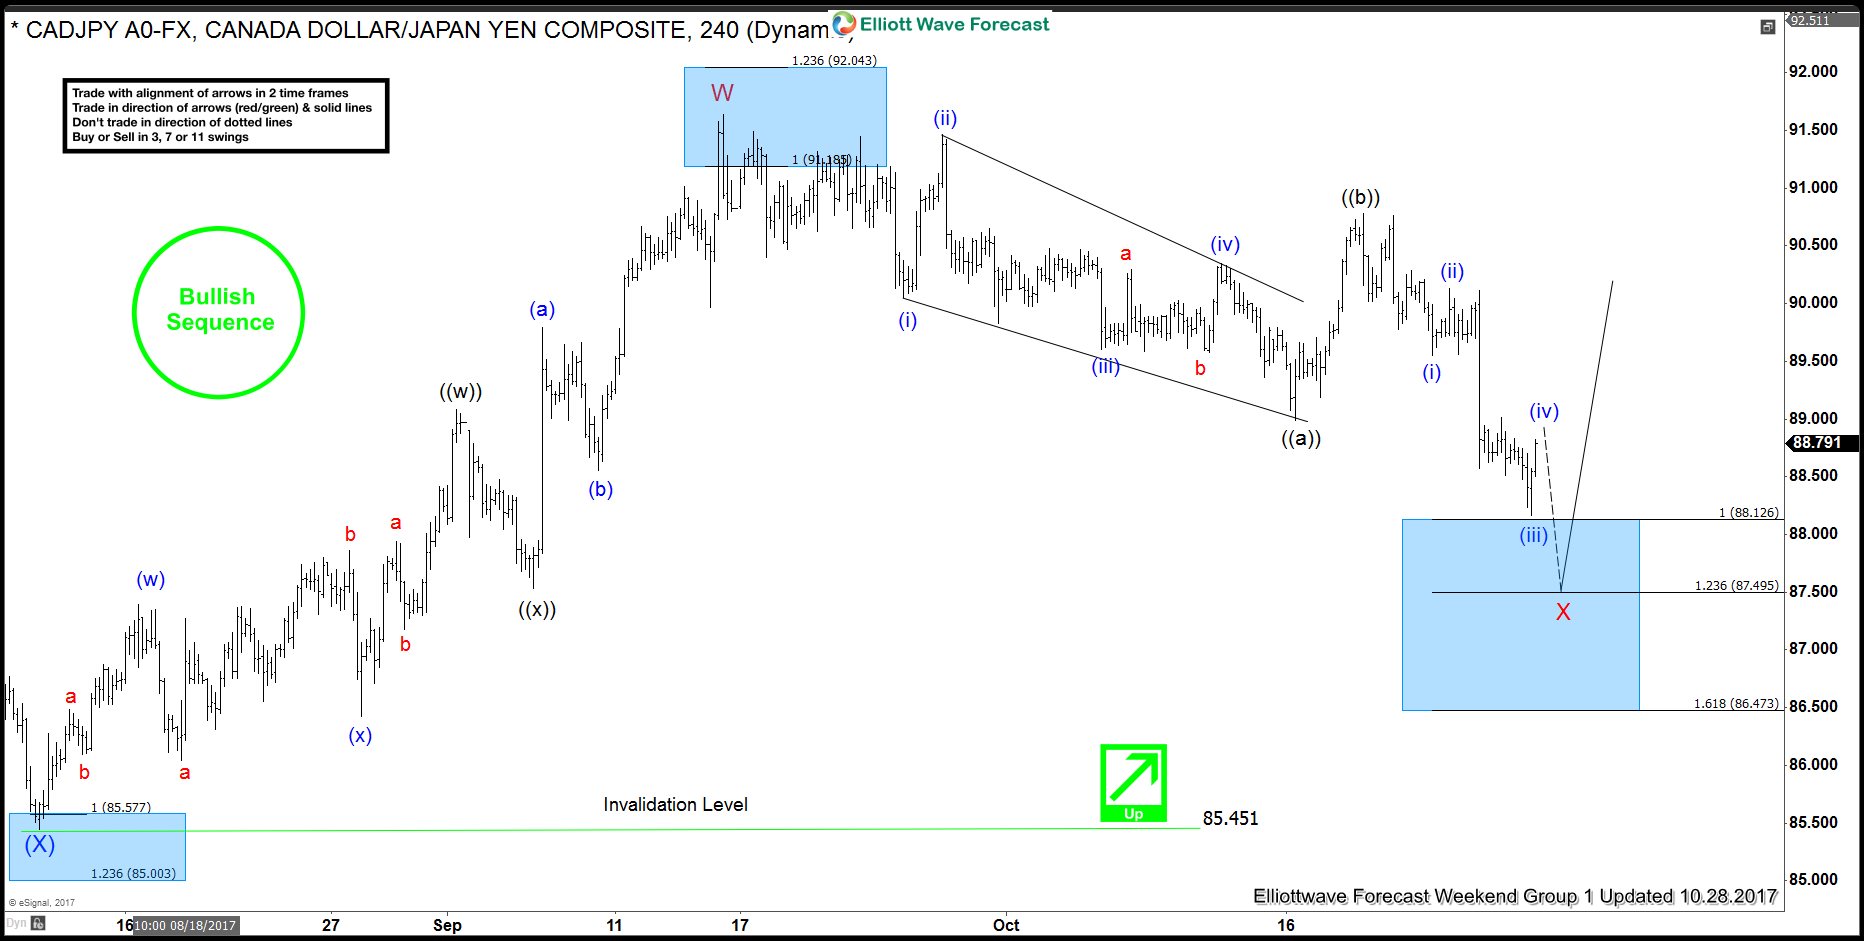
CADJPY 4 Hour Elliott Wave Analysis 10/28/2017
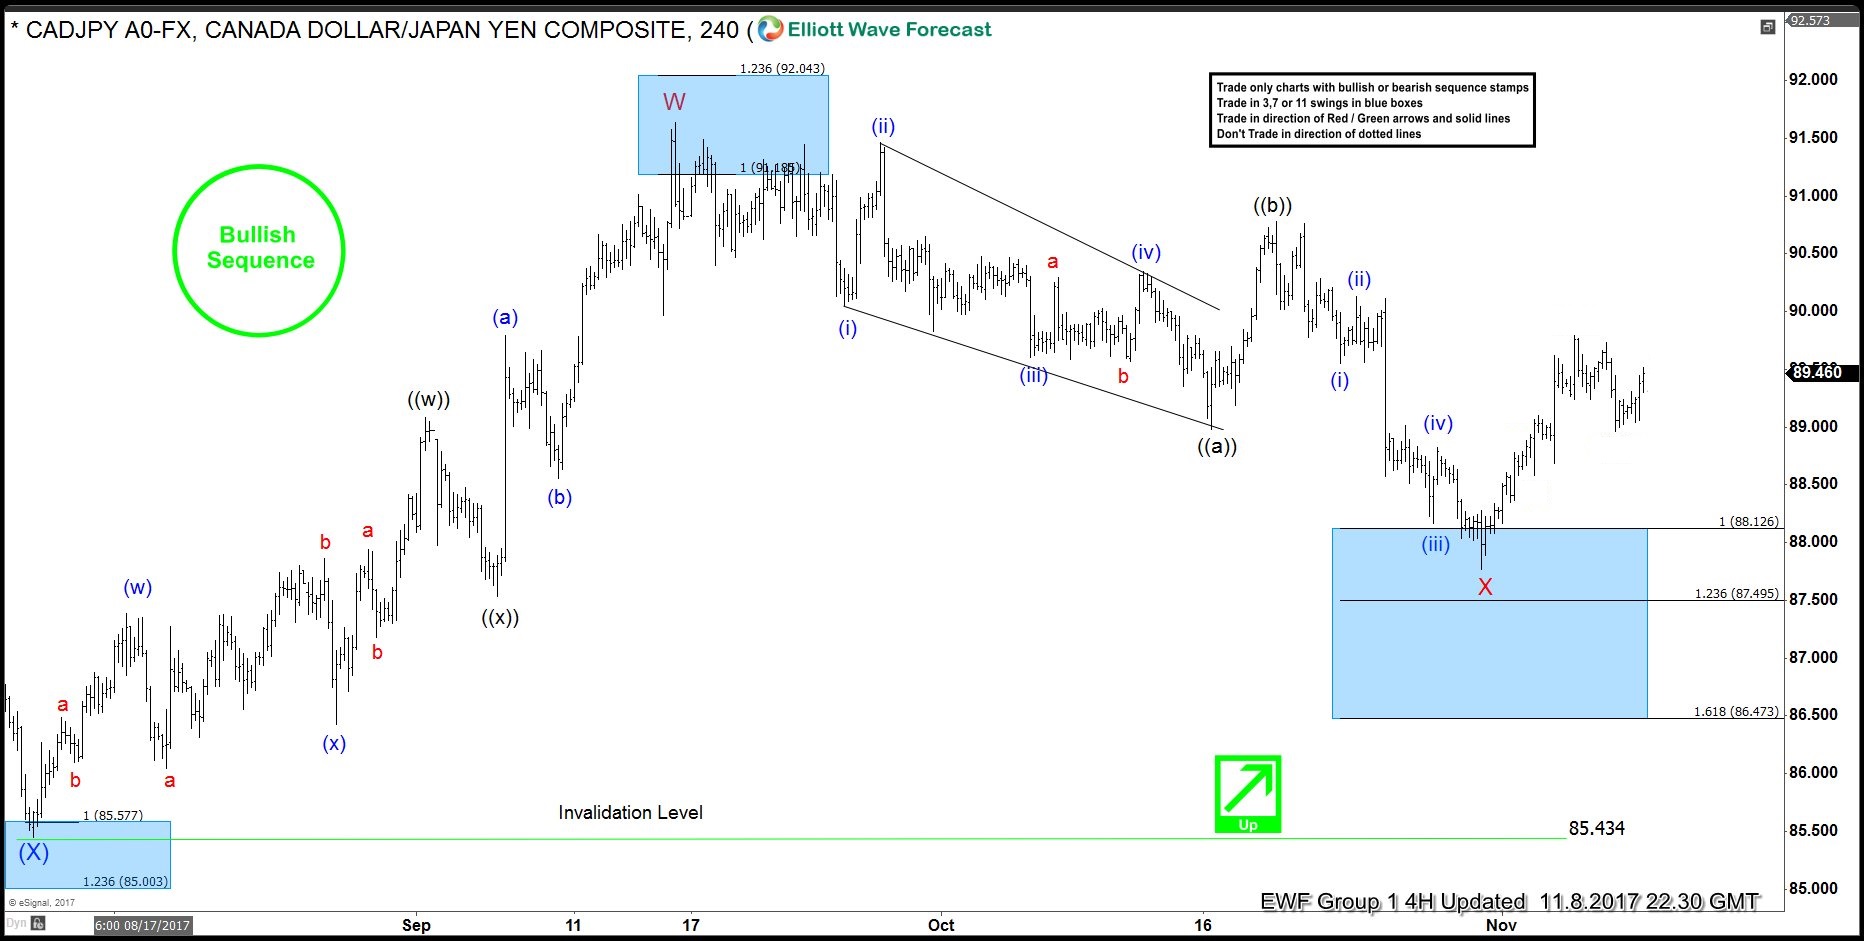
CADJPY chart above shows a green arrow with an invalidation level to indicate the trend is up, it has a bullish sequence stamp, a blue box to highlight the extreme area, dotted line going down to suggest we should not be trading the down move and then a solid line showing the move up from the blue box to show the right side is buying the dips. Our clients bought dips in the blue box and price has since then rallied 200 pips and even though it could still make another low but the bounce of 200 pips allowed traders who got long to get into a risk free position and now it doesn’t matter whether price makes a new low from here or not. Let’s take a look at the most recent chart of CADJPY to see the reaction from the blue box
We use a specific technique to place stop loss and to get into a Risk Free position after a trade is triggered, we explain this to our members every day in our Live Trading Room and talk about it in our Live Analysis Sessions and 24 Hour chat room. If you would like to access our analysis and be able to get a Forecast which is not just a Forecast but a complete Trading system, then don’t delay and Start Your Free 14 Day Trial of Elliott Wave Forecast today. If you have taken a Trial before or been a member in the past, start with one of the Monthly Subscription Plans today!
Back


