Hello fellow traders. In this technical article we’re going to take a quick look at the weekly Elliott Wave charts of SPDR Industrial ETF (XLI) , published in members area of the website. As many of our members are aware, the ETF has given us good buying opportunities recently. XLI hit our buying zone and completed a correction at the Equal Legs (Blue Box Area). In the following sections, we’ll take a look into the Elliott Wave pattern and our trading setup.
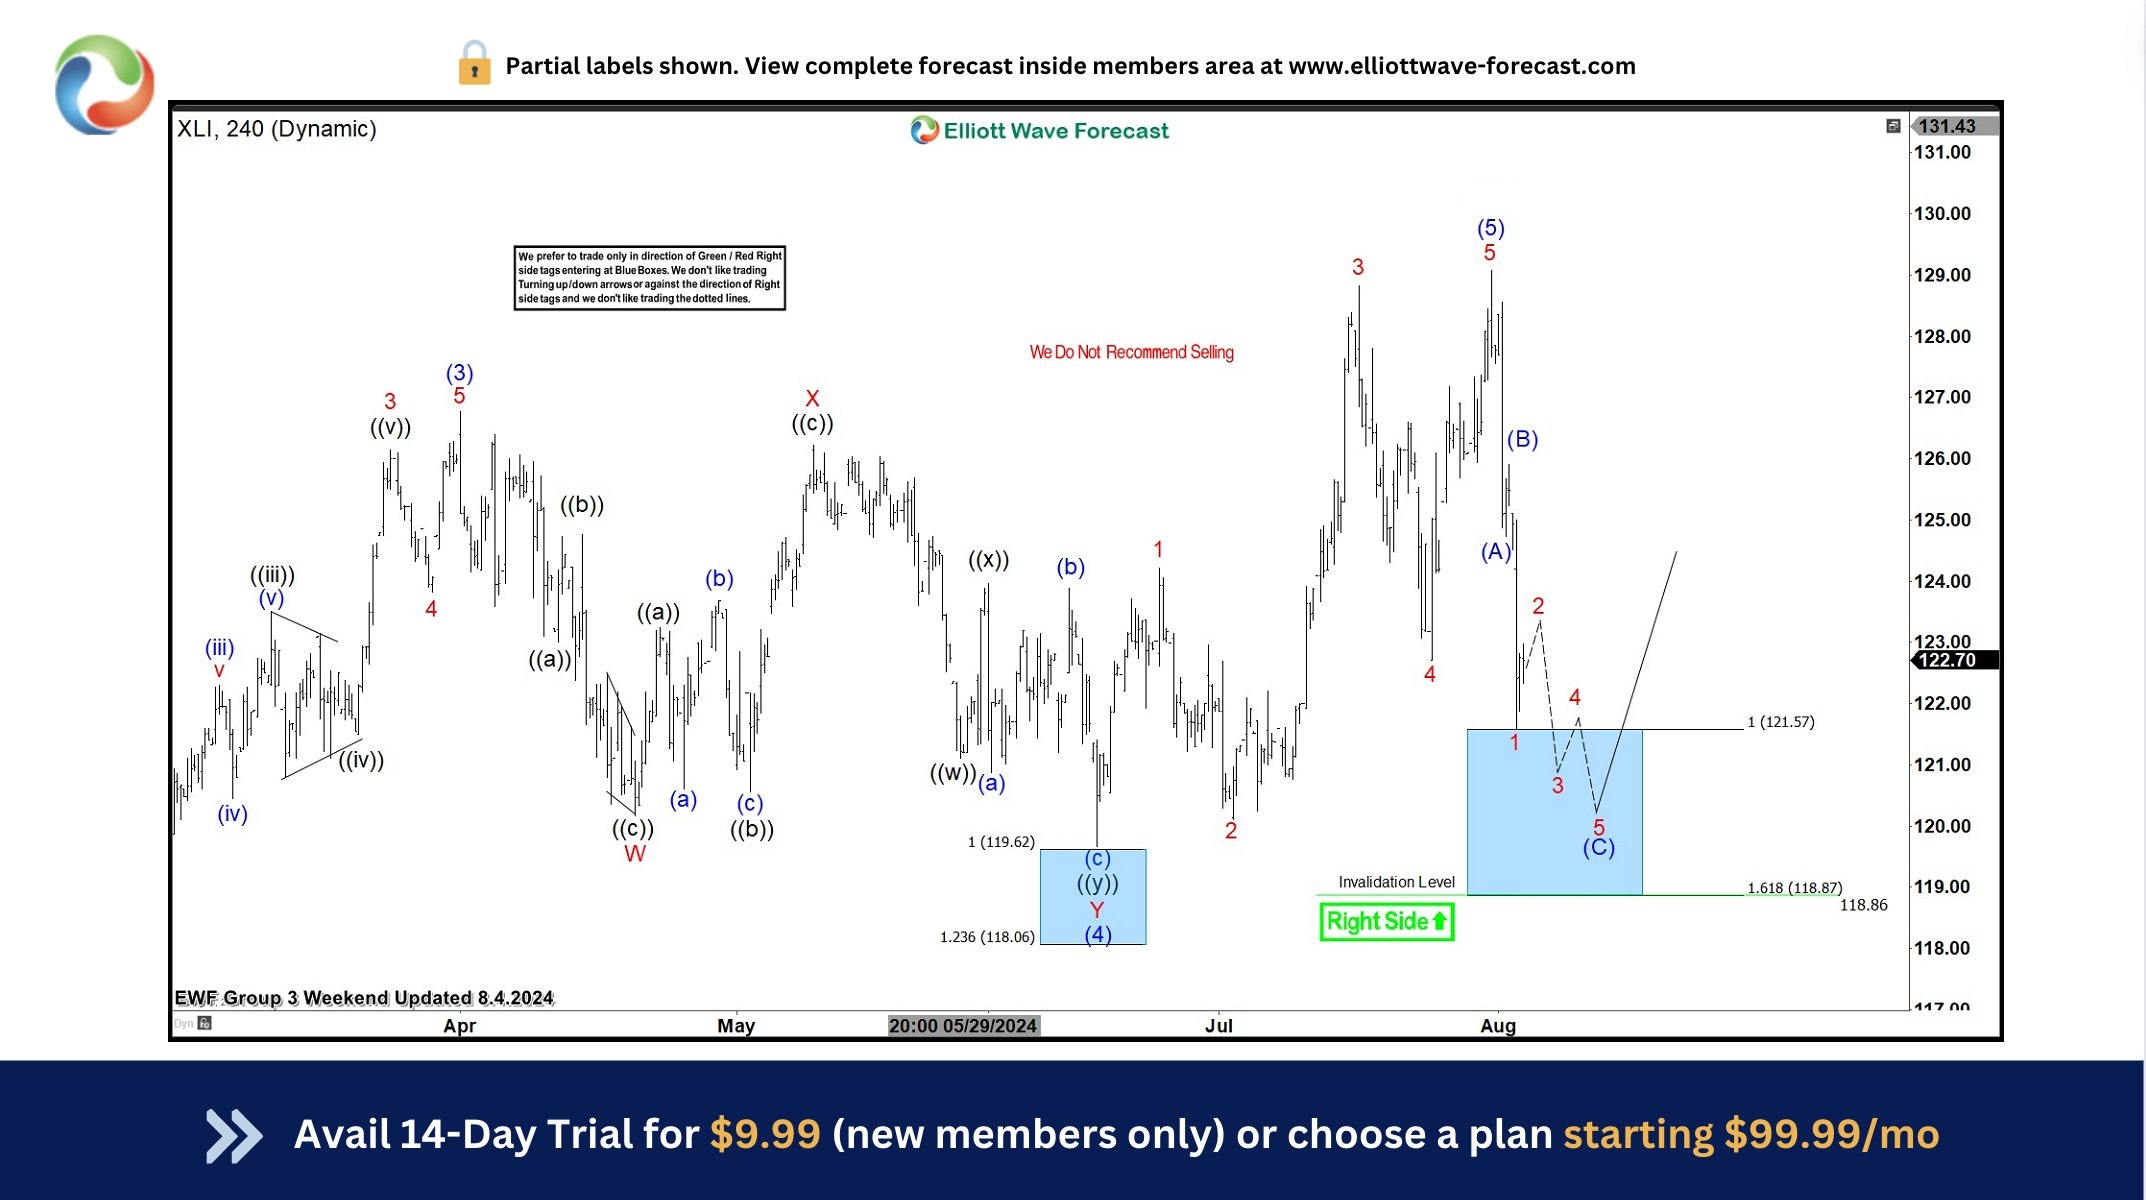
XLI H4 Update 08.04.2024
The ETF is giving us correction that is unfolding as 3 waves pattern , labeled as (A)(B)(C) blue. The pullback has already reached the extreme zone (Blue Box) . However we expect to see more short term weakness in near term. At this stage, we advise against selling the ETF and favor the long side from the H4 Blue Box area. XLI could either see a rally to new highs or a larger corrective bounce in at least three waves.
A quick reminder:
Our charts are designed for simplicity and ease of trading:
- Red bearish stamp + blue box = Selling Setup
- Green bullish stamp + blue box = Buying Setup
- Charts with Black stamps are deemed non-tradable. 🚫
If you want to learn more about Elliott Wave Patterns, we invite you to explore our Free Elliott Wave Educational Web Page.
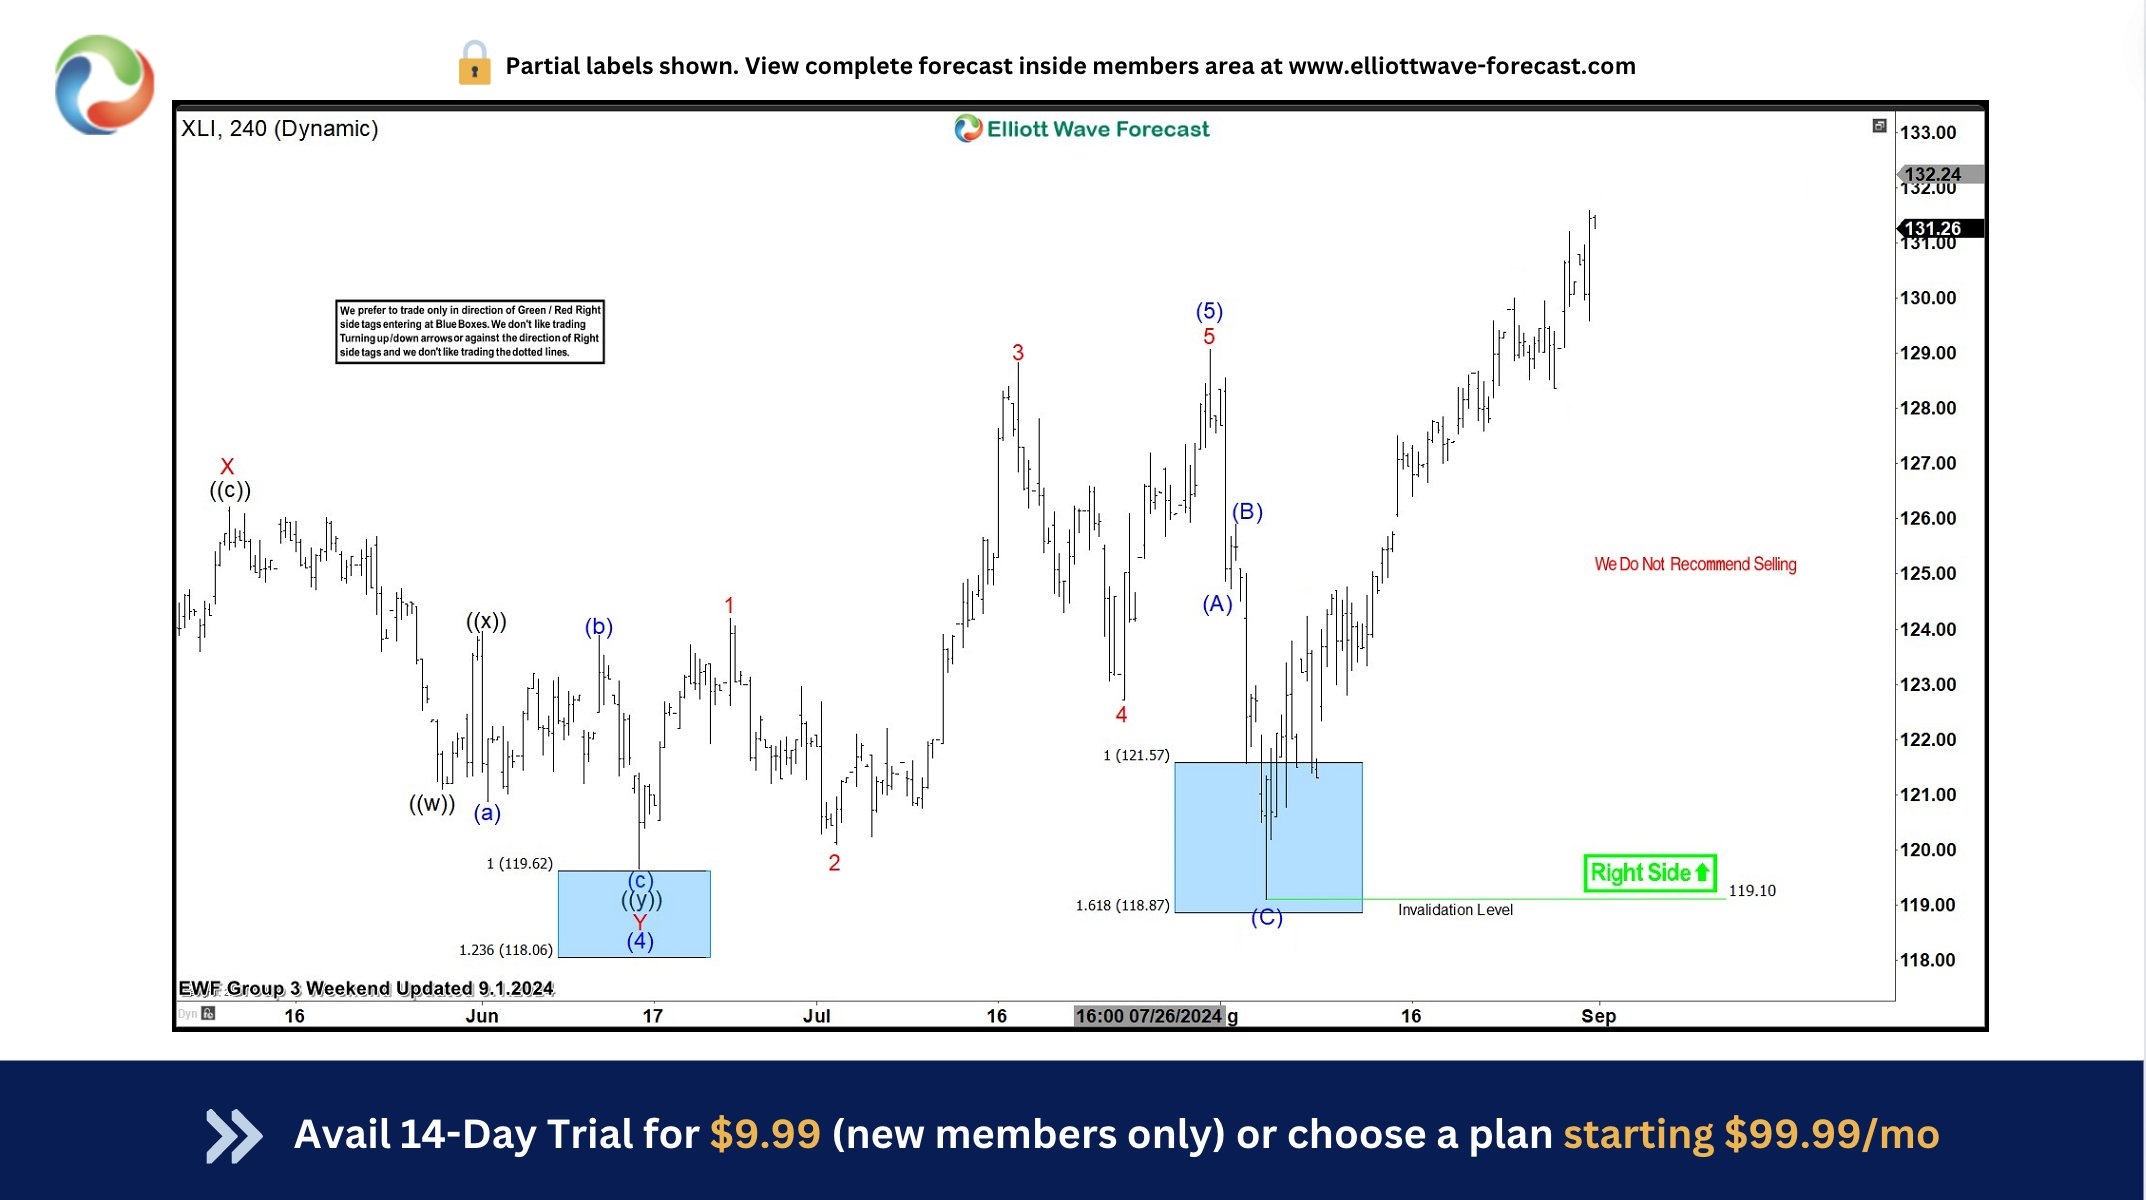
XLI H4 Update 09.01.2024
XLI responded exactly as anticipated at the Blue Box Area, attracting buyers and initiating a substantial rally from our recommended buying zone. We got break toward new highs confirming next leg up is already in progress.
For the latest updates, refer to the most recent charts available in our membership area. We focus on trading instruments with incomplete bullish or bearish swing sequences. The Live Trading Room highlights the best opportunities in real-time.


