In this blog, AAPL has been in a strong up trend with right side up in all time frames. We have developed a Right Side system which combines Elliott Wave, Cycles and Sequences and consists of Right side up, Right side down, turning up and turning down arrows. We only trade in direction of the Right side and once right side has been determined, only thing left is to determine the buying or selling areas. We determine buying or selling area through inflection zones which are extension zones and are areas from where either the market will resume the move in direction of the right side or produce a 3 waves reaction at minimum as far as the extreme of the blue box is not breached. We highlight these areas on the charts using blue boxes to make it easier for the clients. In this blog, we will take a look at a recent buying opportunity that presented itself in AAPL earlier this week using the Right side system.
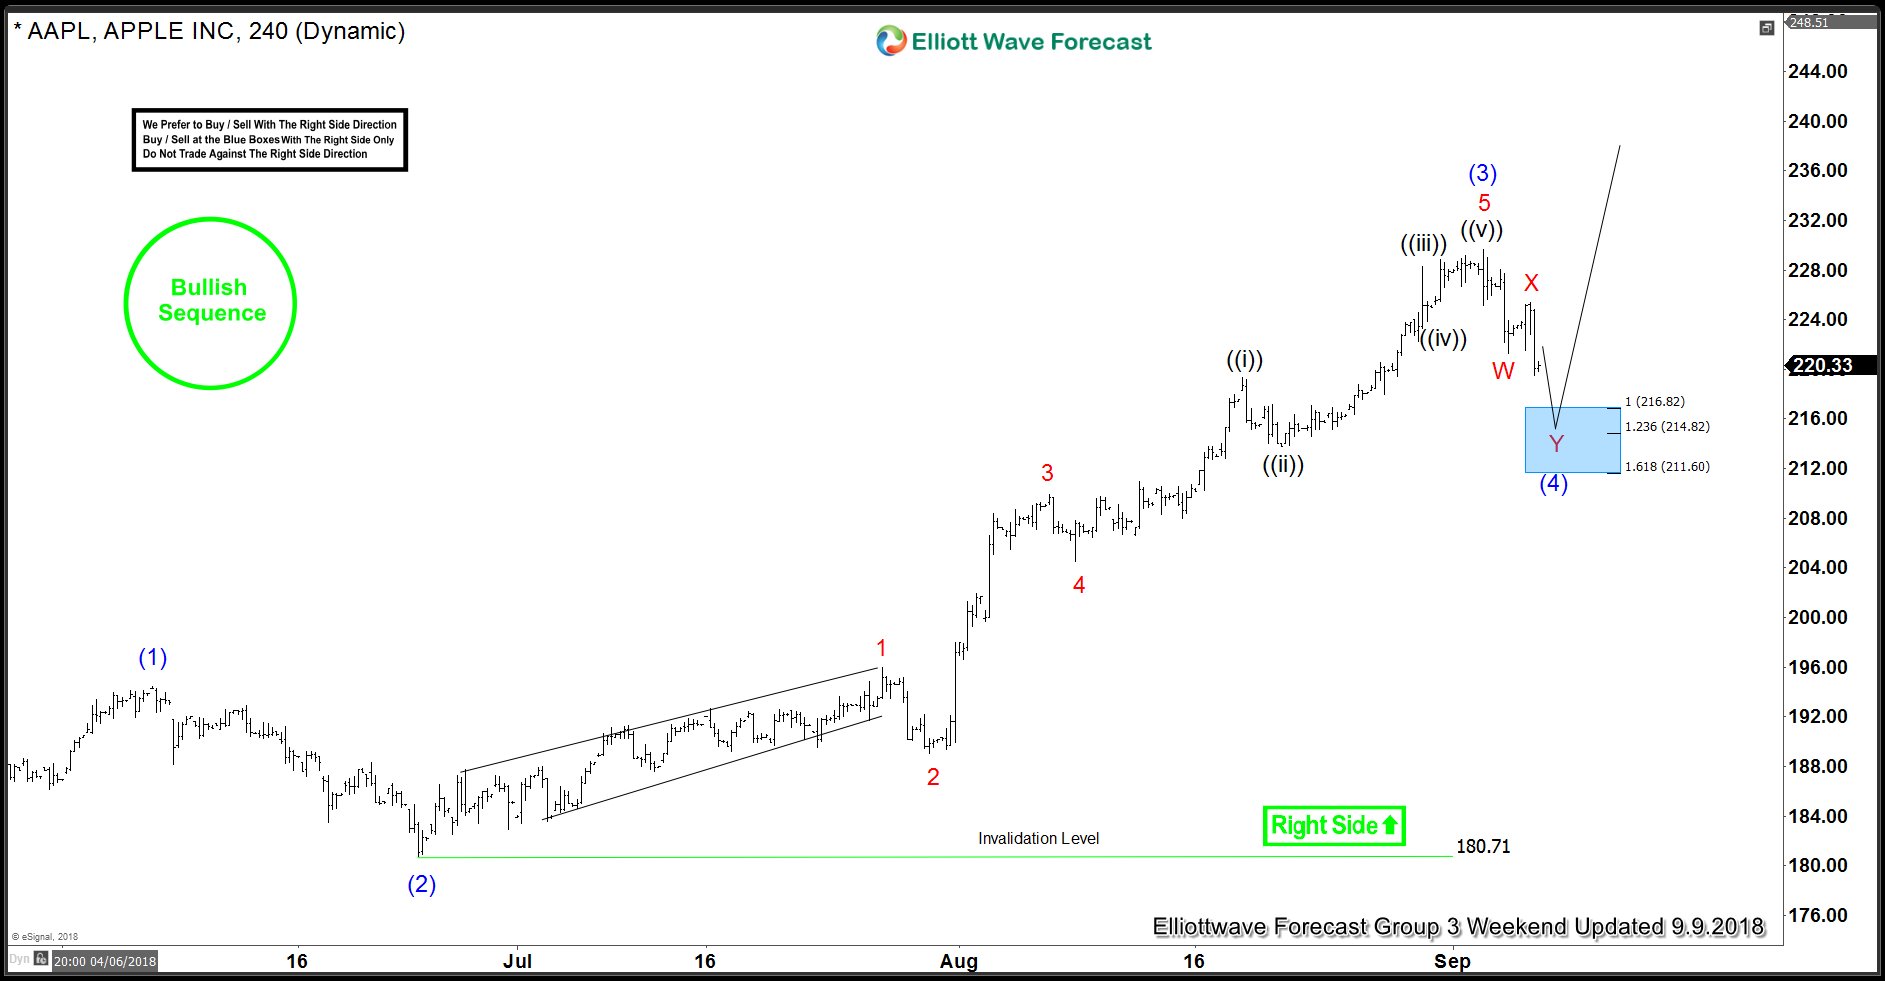
AAPL 4 Hour Elliott Wave Analysis 9.9.2018
AAPL formed a short-term peak on 9/5/2018 (229.67) and started pulling back. At the closing on 9/7/2018, it was showing 5 swings down from 229.67 peak which was an incomplete sequence and called for another swing lower towards 216.82 – 211.60 area to complete 7 swings down from 229.67 peak. We can see on the chart there is a Bullish sequence tag to show sequence in 4 Hour time frame was bullish, there was also a green Right side tag pointing up which made it further clear that Right side was up so we were only looking for buying opportunities in the dips. Blue box on the chart between 216.82 – 211.60 highlighted the buying area from where rally was expected to resume or at least result in a 3 waves reaction higher.
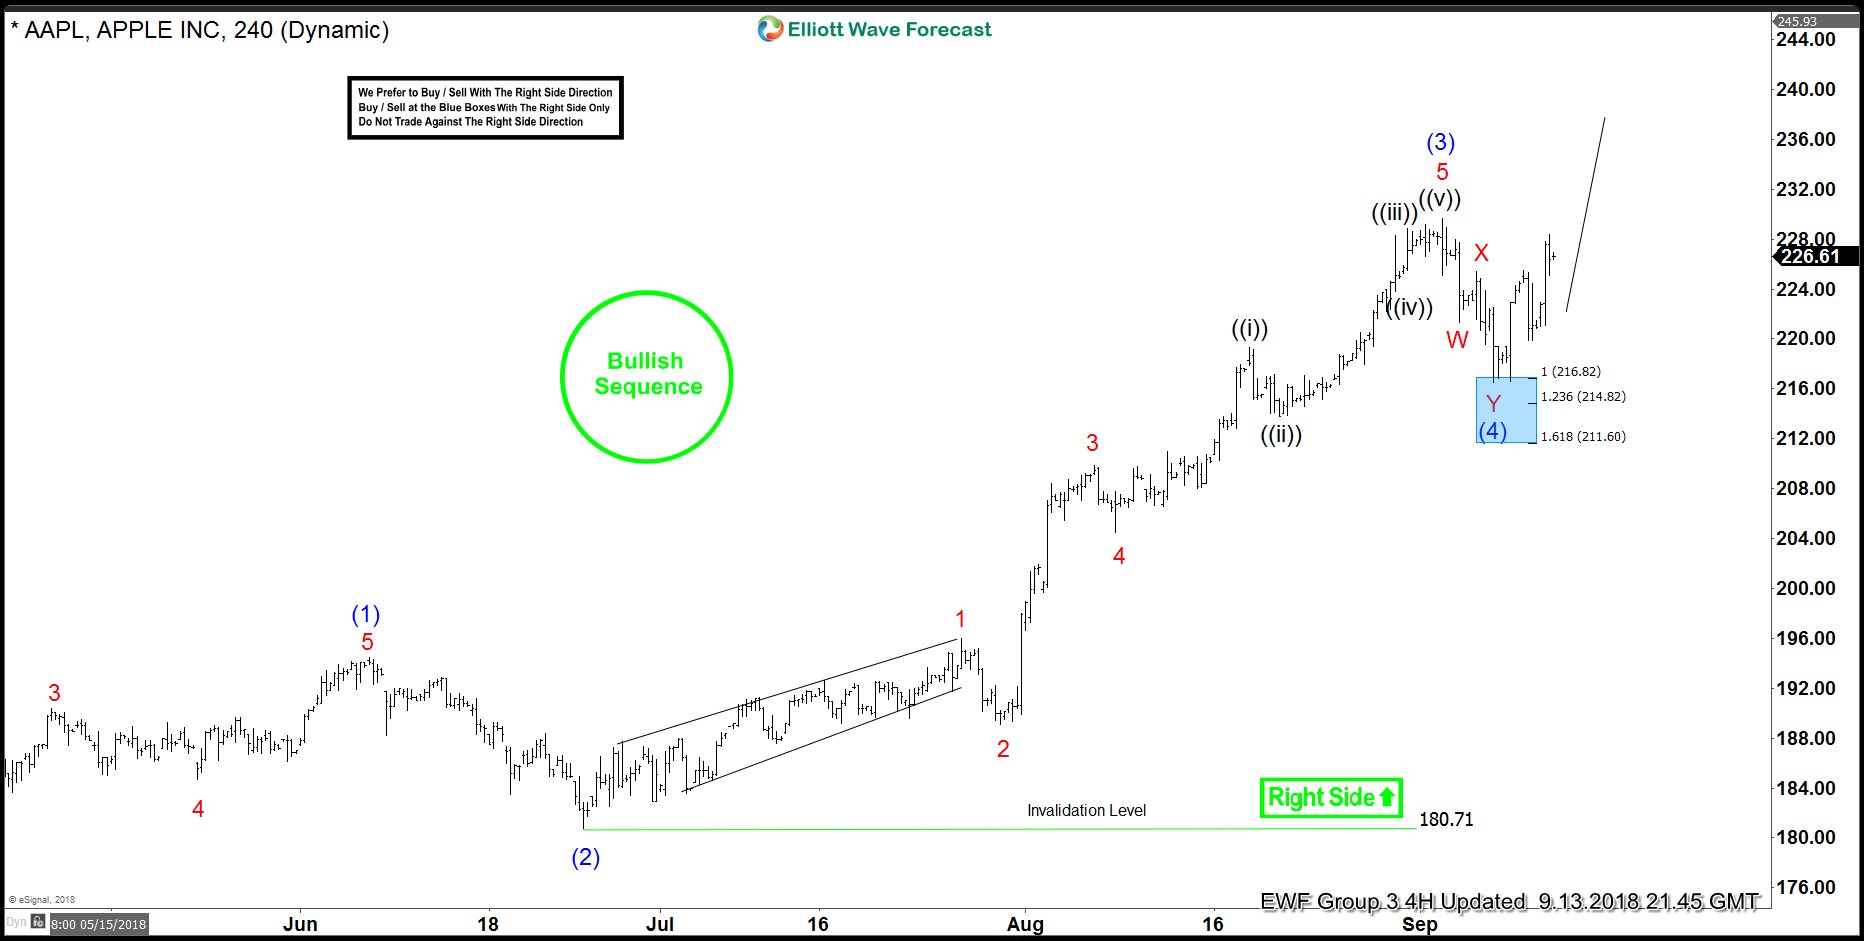
AAPL 4 Hour Elliott Wave Analysis 9.13.2018
AAPL reached the blue box area on Monday and bounced as expected. Reaction higher allowed buyers a chance to eliminate risk on the trade and should now be in a risk free position. Peak at 229.57 is still intact and needs to break to confirm wave (5) high has started. Until then, another drop below 216.47 low can’t be ruled out as a larger double correction in wave (4). In case that happens, we would expect buyers to appear again at the next blue box area that we would present on the chart if 216.47 low breaks.
Bottom line is trading with the right side makes it easier and that’s what we do at Elliottwave-Forecast . To learn more about how to Trade with the Right Side using Elliott Wave Theory, Cycles and Sequences, register for our upcoming Educational Webinar
Back


