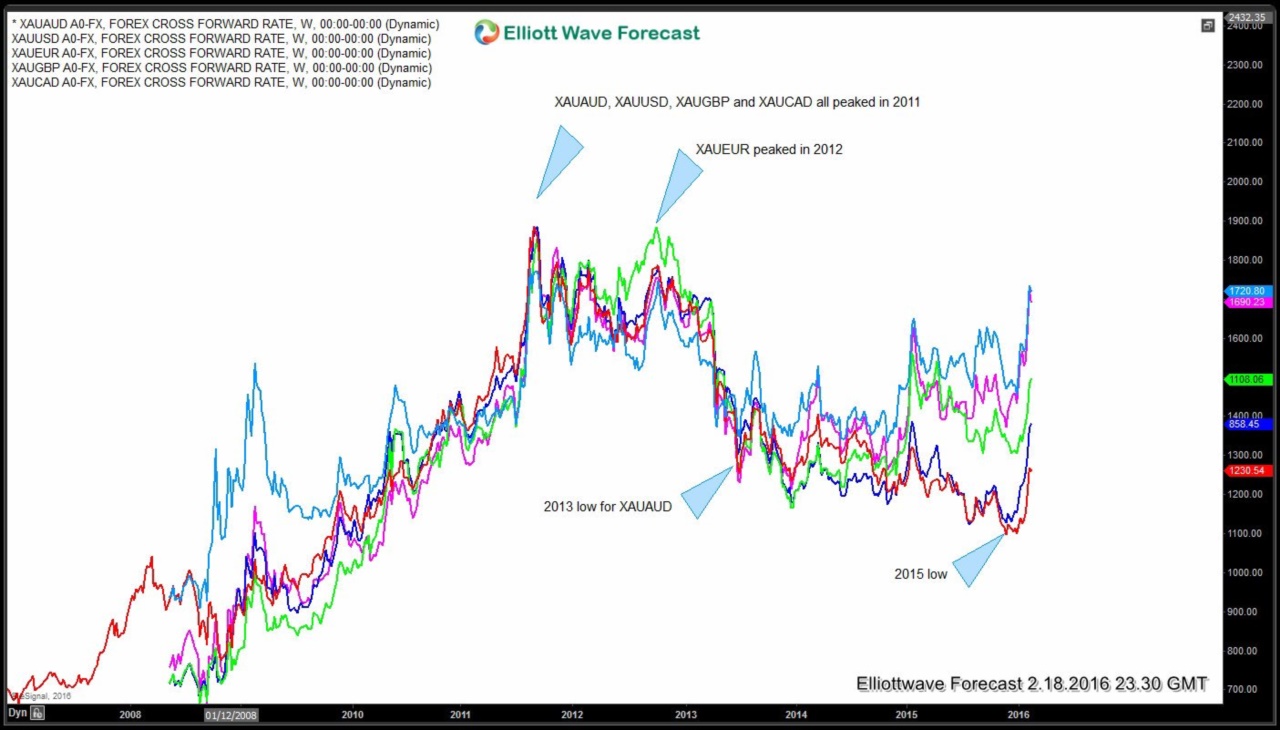
Gold (XAU) formed a peak against most major world currencies in 2011. This included XAUAUD, XAUUSD, XAUGBP and XAUCAD while XAUEUR peaked a little later in 2012. This was an important peak and resulted in a few years of downward price action in Gold against all major World currencies.
Since December 2015, Gold has been rallying against US Dollar and gained 20.7% rising from a low of 1046 on 12/3/2015 to a high of 1263.37 on 2/11/2016, however, this rally is not enough to suggest that it’s all over for the bears and Gold has started a new bullish cycle which would eventually take it to new all time highs. Therefore, we look for clues elsewhere to see if this rally will extend or fail.
Let’s take a look at the chart of Gold against major World currencies.
XAUAUD – Light Blue, XAUUSD – Red, XAUEUR – Geen, XAUGBP – Dark Blue, XAUCAD – Pink
In the chart above, we can see after forming a peak in 2011 against most major currencies, Gold declined until 2013 against all the currencies. It formed a low against AUD and EUR in 2013 and after a bounce declined further against other currencies into 2015 before turning higher again. Now, we can see that XAUAUD and XAUCAD are quite close to 2011 peaks while others are lagging.
As XAUAUD is quite close to 2011 peak, it’s worth taking a look at the Elliott wave count and cycles in the instrument to see what the preferred out come looks like.
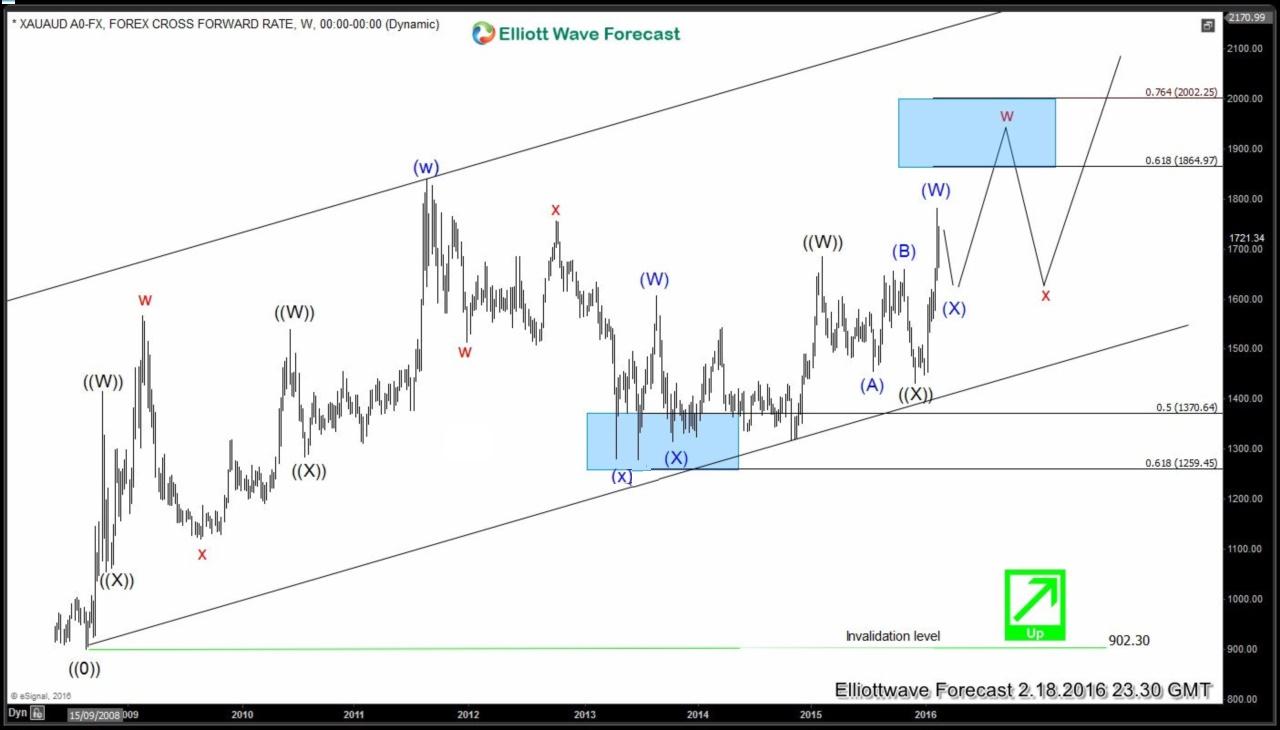
XAUAUD – Weekly Elliott Wave Analysis
Rally from 2008 low to 2011 high was a double three (wxy) structure. This was followed by a 3 wave pull back to 50 – 61.8 Fibonacci retracement zone followed by a turn higher again. Up from blue (x) low at 1278.71 seen in 2013, we can see instrument is showing 5 swings up which means pull backs should now hold above 1432.06 low for another extension higher and next leg higher can break the 2011 peak . Break above 2011 peak will make the sequence from 2008 low bullish and would suggest any dips should then hold above blue (x) low for more upside towards 2224 – 2446 area at least.
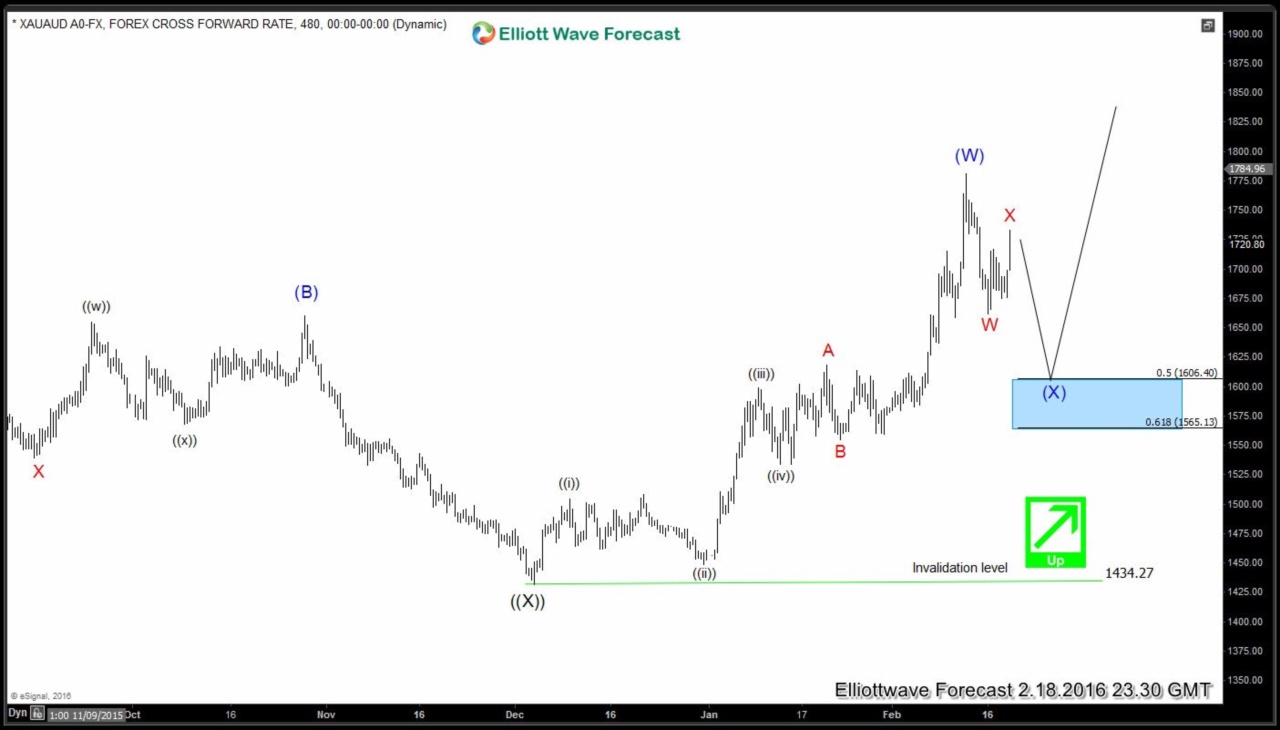
XAU-AUD 480 minute Elliott Wave Analysis
XAUAUD has ended a zig-zag (ABC) sequence from ((X)) low and now is in a pull back to correct the cycle from 1434.27 ((X)) low. Decline so far looks to be in just 1 swing so while below blue (W) peak at 1781.42 high, instrument has scope to make another push lower to complete 3 swings before turning higher again. As we saw above in the weekly chart, there is 5 swings up from 2013 low so we don’t like selling the instrument and expect it to find buyers in the dips in 3, 7 or 11 swings as far as pivot at 1434.27 low remains intact. Later on break of 2011 peak would confirm that XAUAUD has started a new bullish cycle higher and would bode well for further strength in Gold prices against other currencies as well. If instrument breaks above 1781.42 high from current levels, then we think it did a FLAT (3-3-5) structure in blue wave (X).
To see our forecasts for Gold against US Dollar (XAU/USD) and other commodities like Silver, Copper, CL_F, Natgas and other instruments includes Forex, Indices and TNX, sign up for a Free 14 day Trial (limited time offer)
Thanks for reading and Good Luck!
Daud Bhatti
Elliottwave-Forecast Team
Back


