The Travelers Companies, Inc., TRV, is an American insurance company. It is the second-largest writer of U.S. commercial property casualty insurance, and the sixth-largest writer of U.S. personal insurance through independent agents.
Experts have mixed opinions about Travelers Companies (TRV) stock for 2025. Analysts have provided a consensus price target of $263.37, with estimates ranging from $203.00 to $310.00. Some analysts are optimistic, highlighting potential upside and recommending a buy rating, while others suggest holding the stock due to market uncertainties.
Elliott Wave View:
Wave ((II)) for TRV ended at 77.22 low. The stock remained in wave ((III)) but shifted to wave (I) of ((III)). Wave I concluded at 187.98, followed by a pullback marking wave II at 149.65. The rally resumed, breaking the wave I high, signaling the start of wave III of (I).
We anticipated one final push upward to complete wave ((5)) of III and wave III of (I), it ended at 269.54 high. The wave IV pullback also ended at 230.23 low and now is trading higher in wave V of (I). (If you want to learn more about flat corrections, please follow these links: and .)
Weekly TRV Chart December 2024
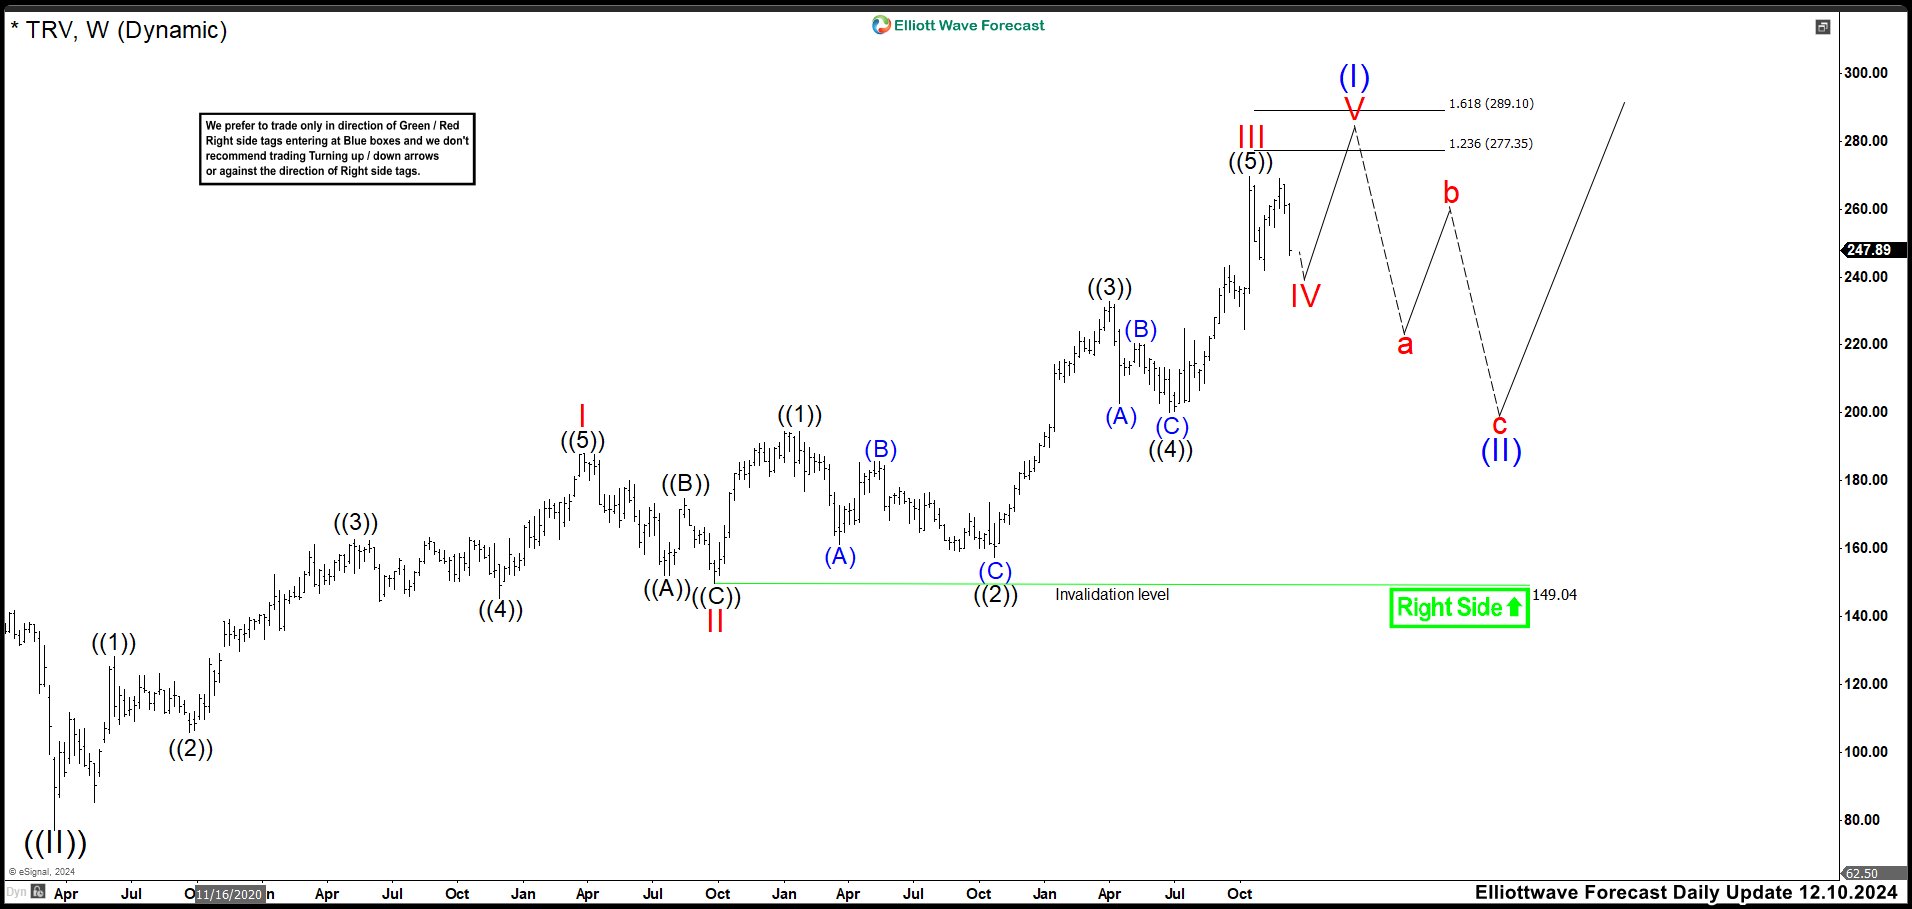
In December, TRV rallied to 269.56, exceeding the expected range of 240.74–253.27. Shortly afterward, the market reacted lower, signaling the start of wave IV. We labeled the 269.56 high as wave III. Subsequently, the price moved lower to complete wave IV as a flat structure, ending at 230.23. I little lower that the expected zone of 241.57–234.99. Then, we were expecting to continue the rally as wave V of (I) to 277.35 – 289.10 area before seeing a pullback as wave (II).
Weekly TRV Chart April 2025
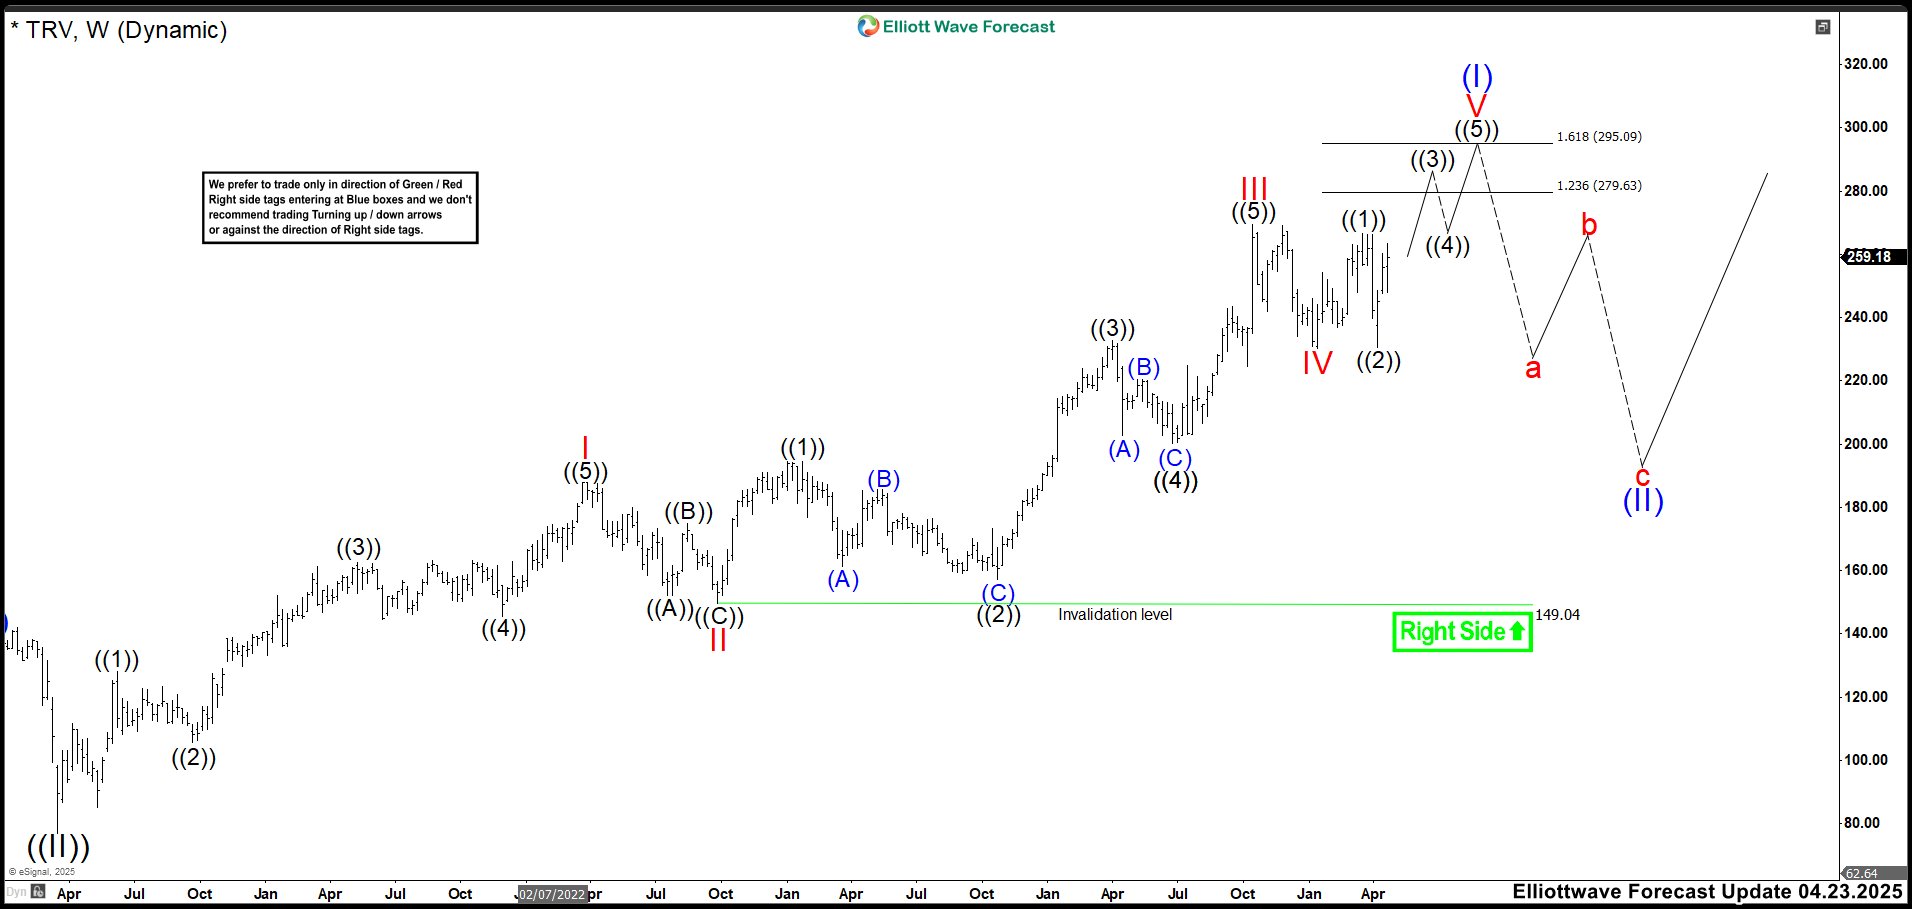
In this latest update, we can clearly observe the structure of wave V. Wave ((1)) peaked at 266.74, followed by a strong correction as wave ((2)), which dropped to 230.43 while staying above the level of wave IV. Now, we anticipate the upward movement to continue, targeting the 279.63 – 295.10 area. This zone is expected to mark the completion of wave V of (I), where the market might react, giving us an indication that wave (II) has begun.
If the market does not show a downward reaction in this area, there is a possibility that wave V could extend its bullish momentum into wave ((3)), pushing TRV above 300. The key will be to monitor the market’s reaction at the projected levels to accurately identify the next move. Let’s see what the market brings us. Trade Smart!
Transform Your Trading with Elliott Wave Forecast!
Ready to take control of your trading journey? At Elliott Wave Forecast, we provide the tools you need to stay ahead in the market:
✅ Hourly Updates: Fresh 1-hour charts updated 4 times a day and 4-hour charts updated daily for 78 instruments.
✅ Blue Boxes: High-frequency trading zones, calculated using sequences, cycles, and extensions. These areas pinpoint ideal setups for smarter trades.
✅ Live Sessions: Join our daily live discussions and stay on the right side of the market.
✅ Real-Time Guidance: Get your questions answered in our interactive chat room with expert moderators.
🔥 Exclusive Offer: Start your journey with a 14-day trial for only $9.99. Gain access to exclusive forecasts and Blue Box trade setups. No risks, cancel anytime by reaching out to us at support@elliottwave-forecast.com.
