The Travelers Companies, Inc., TRV, is an American insurance company. It is the second-largest writer of U.S. commercial property casualty insurance, and the sixth-largest writer of U.S. personal insurance through independent agents.
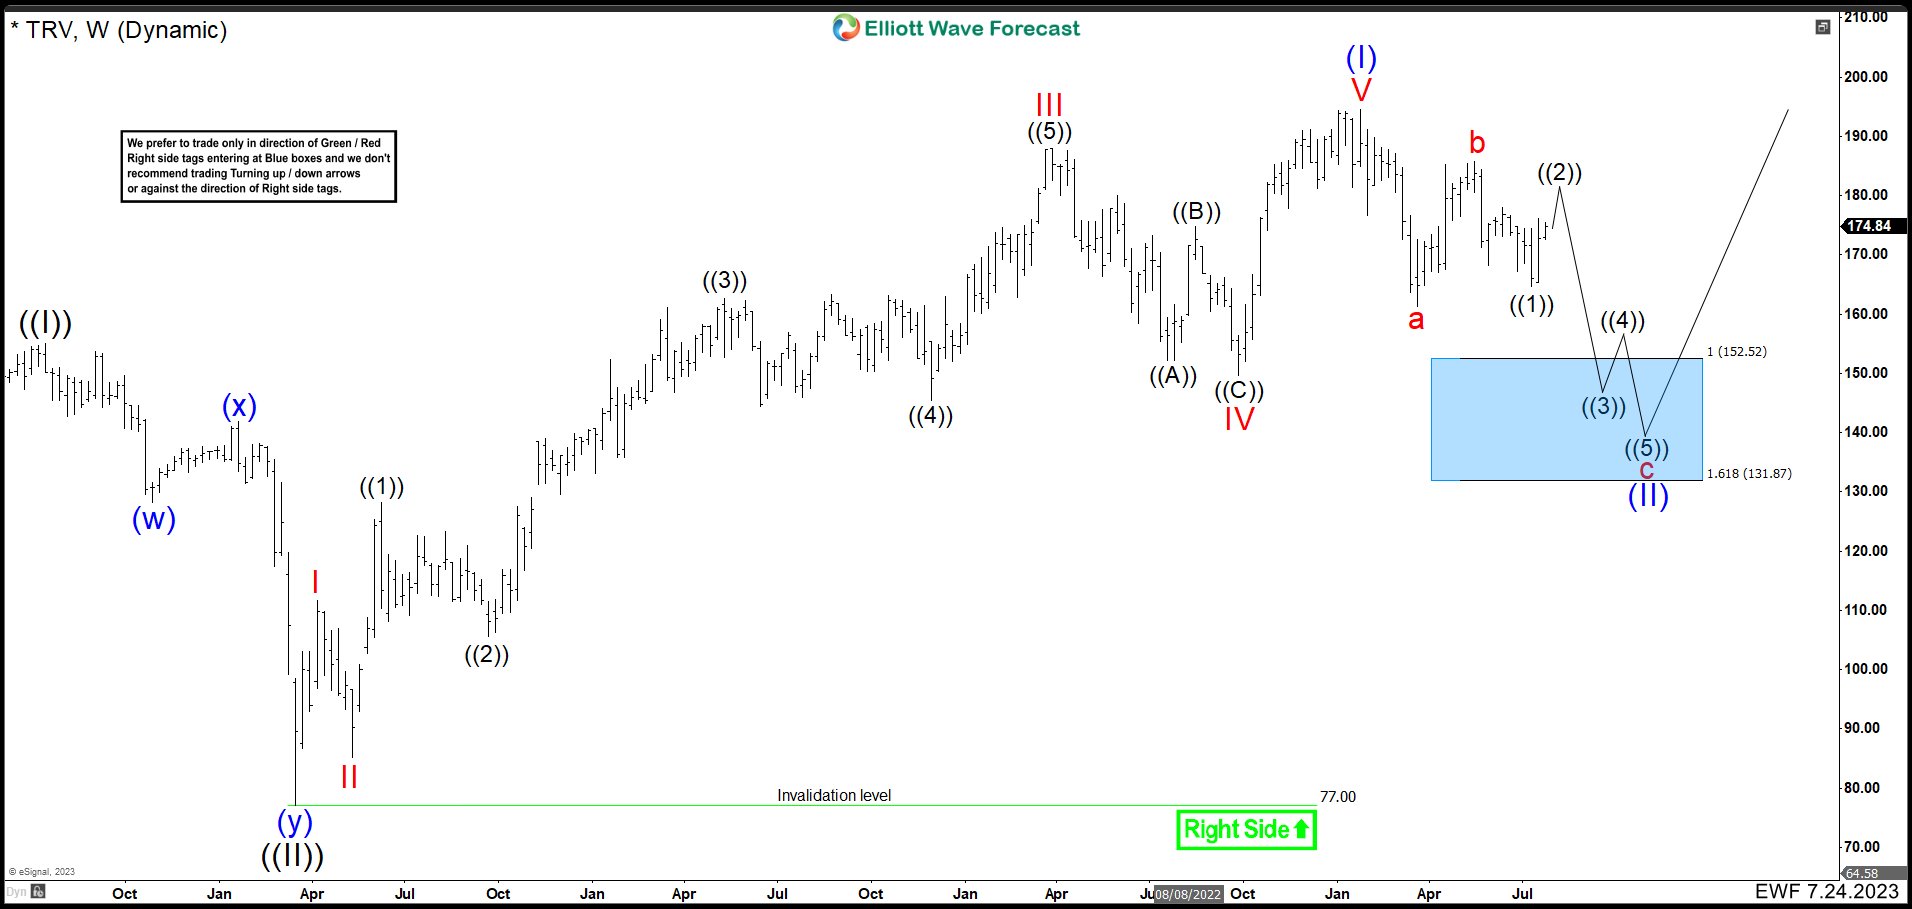
Weekly TRV Chart July 2023
 TRV ended a great super cycle in the year of 2019 reaching a peak at $154.86 which we call the wave ((I)). Then the market made a quick and strong correction driven by the COVID19 pandemic in 2020. The company lost 50% of its value reaching $76.99 per share in March. This culminated wave ((II)) and we are currently building wave ((III)). Wave (I) of ((III)) ended at $194.51 in January 2023 building an impulse and it has been correcting in wave (II) of ((III)) ever since.
Wave “a” of (II) fell to the price of $161.33 in March and the rebound as wave “b” ended at $185.77. As long as the price action is below this level, we expect to continue to the downside building an impulse as wave “c” of (II). The blue box is in the 152.52 – 131.87 area, from where we should finish the wave ((II)) and continue the rally or see 3 swings up at least.
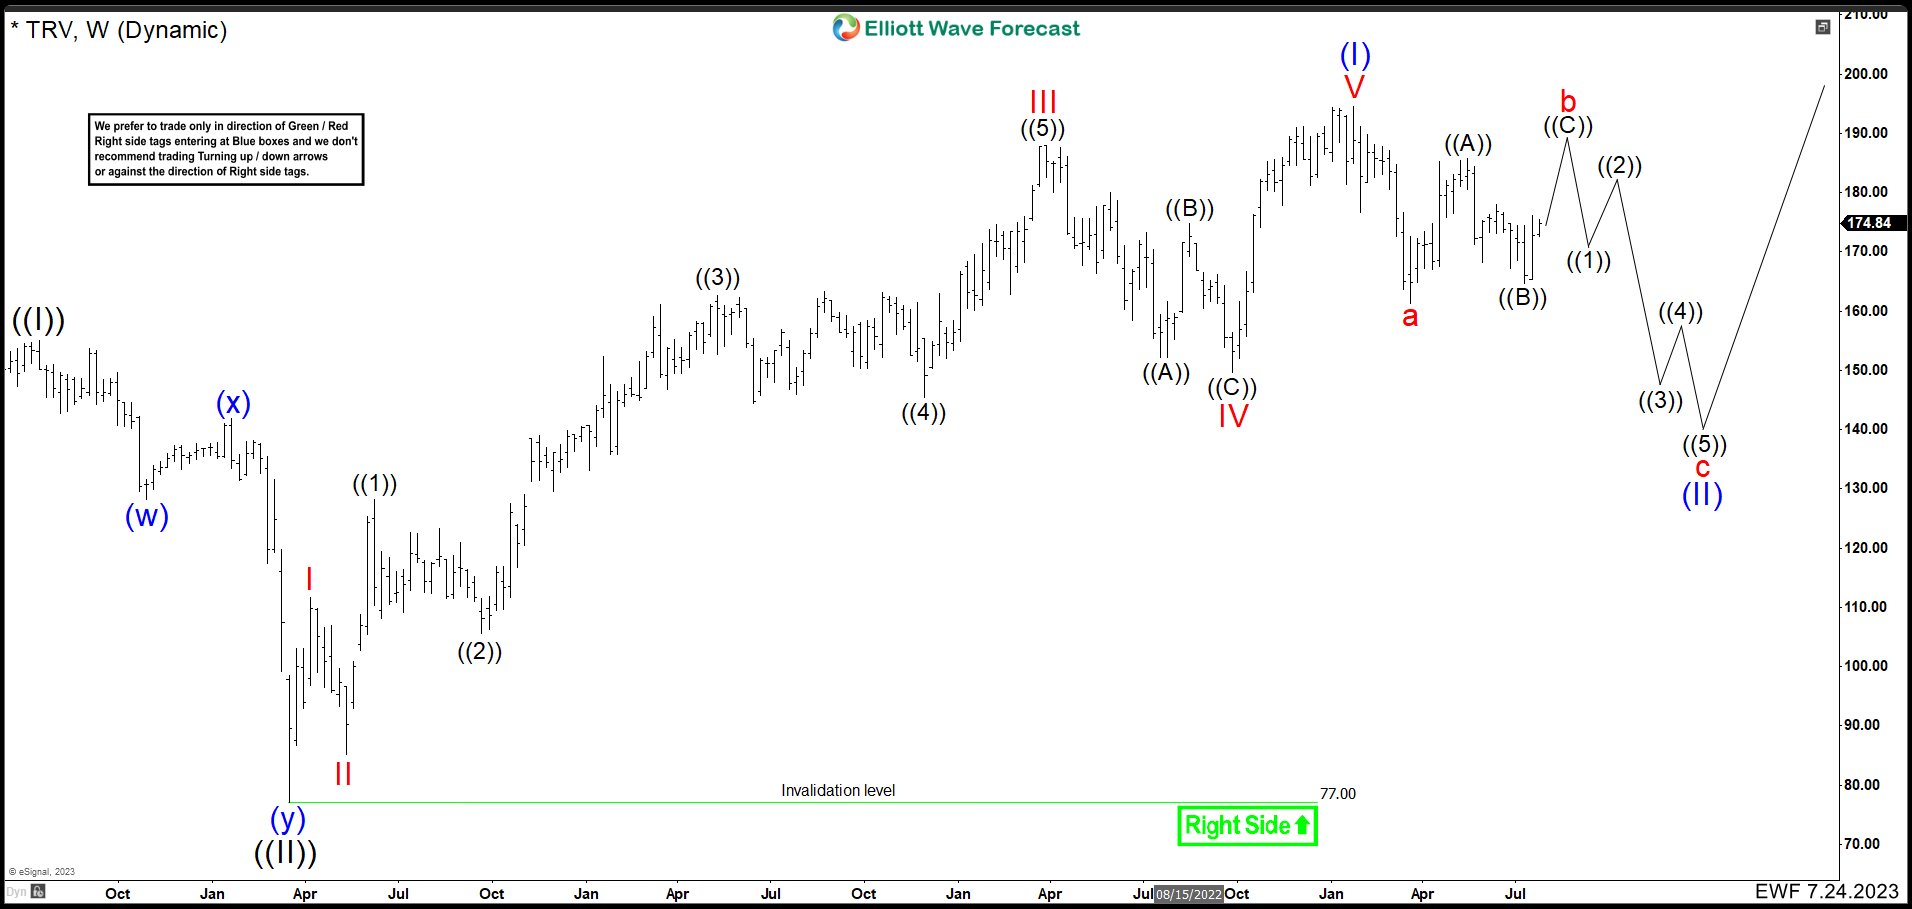
Weekly TRV Alternative Chart July 2023
As an alternative to the previous chart, we see the possibility that wave “b” has not ended yet. This means that it should break above $185.77, reach around $189.22 and turn lower as wave “c”. (If you want to learn more about Elliott Wave Theory, follow these links: Elliott Wave Education and Elliott Wave Theory).
Source: Travelers (TRV) Is Correcting The Cycle From March 2020 Low. (elliottwave-forecast.com)
Take 14 Days Trial
Elliottwave Forecast updates one-hour charts 4 times a day and 4-hour charts once a day for all our 78 instruments. We do a daily live session where we guide our clients on the right side of the market. In addition, we have a chat room where our moderators will help you with any questions about the market.
Let’s trial 14 days for only $9.99 here: I want 14 days trial. Cancel Any time at support@elliottwave-forecast.com
Back

