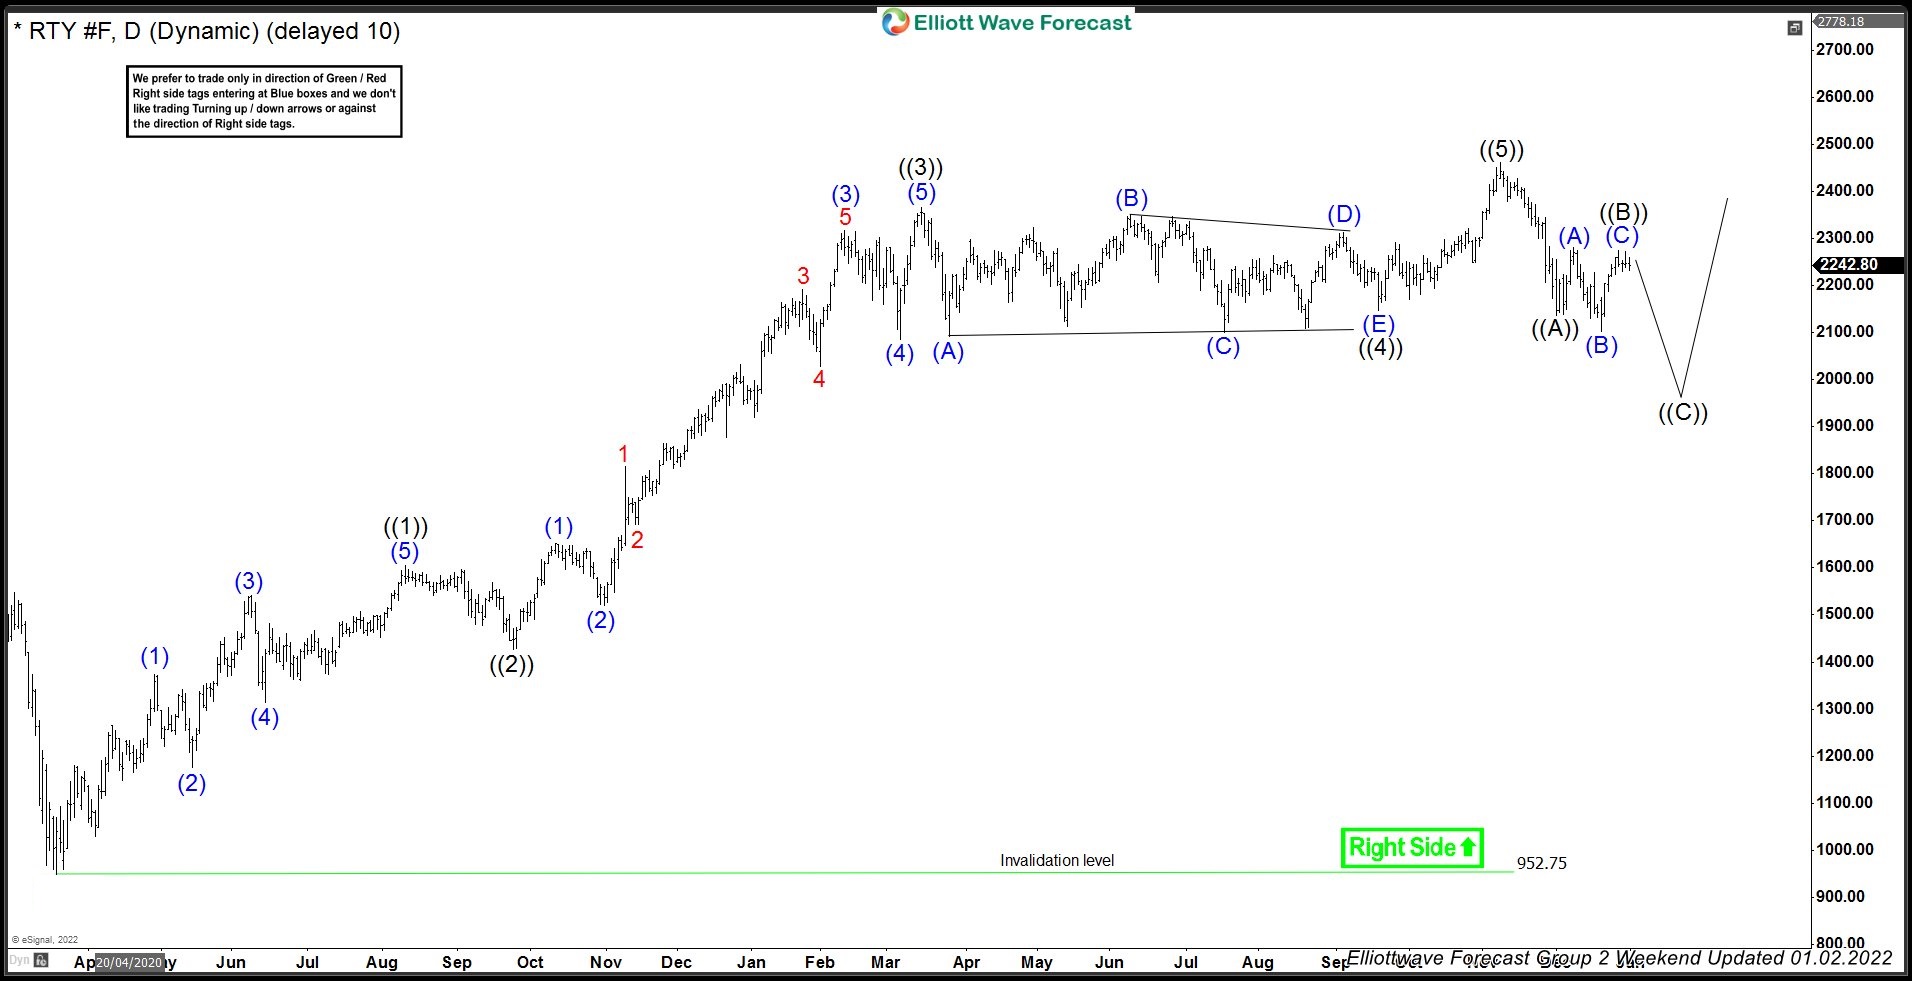
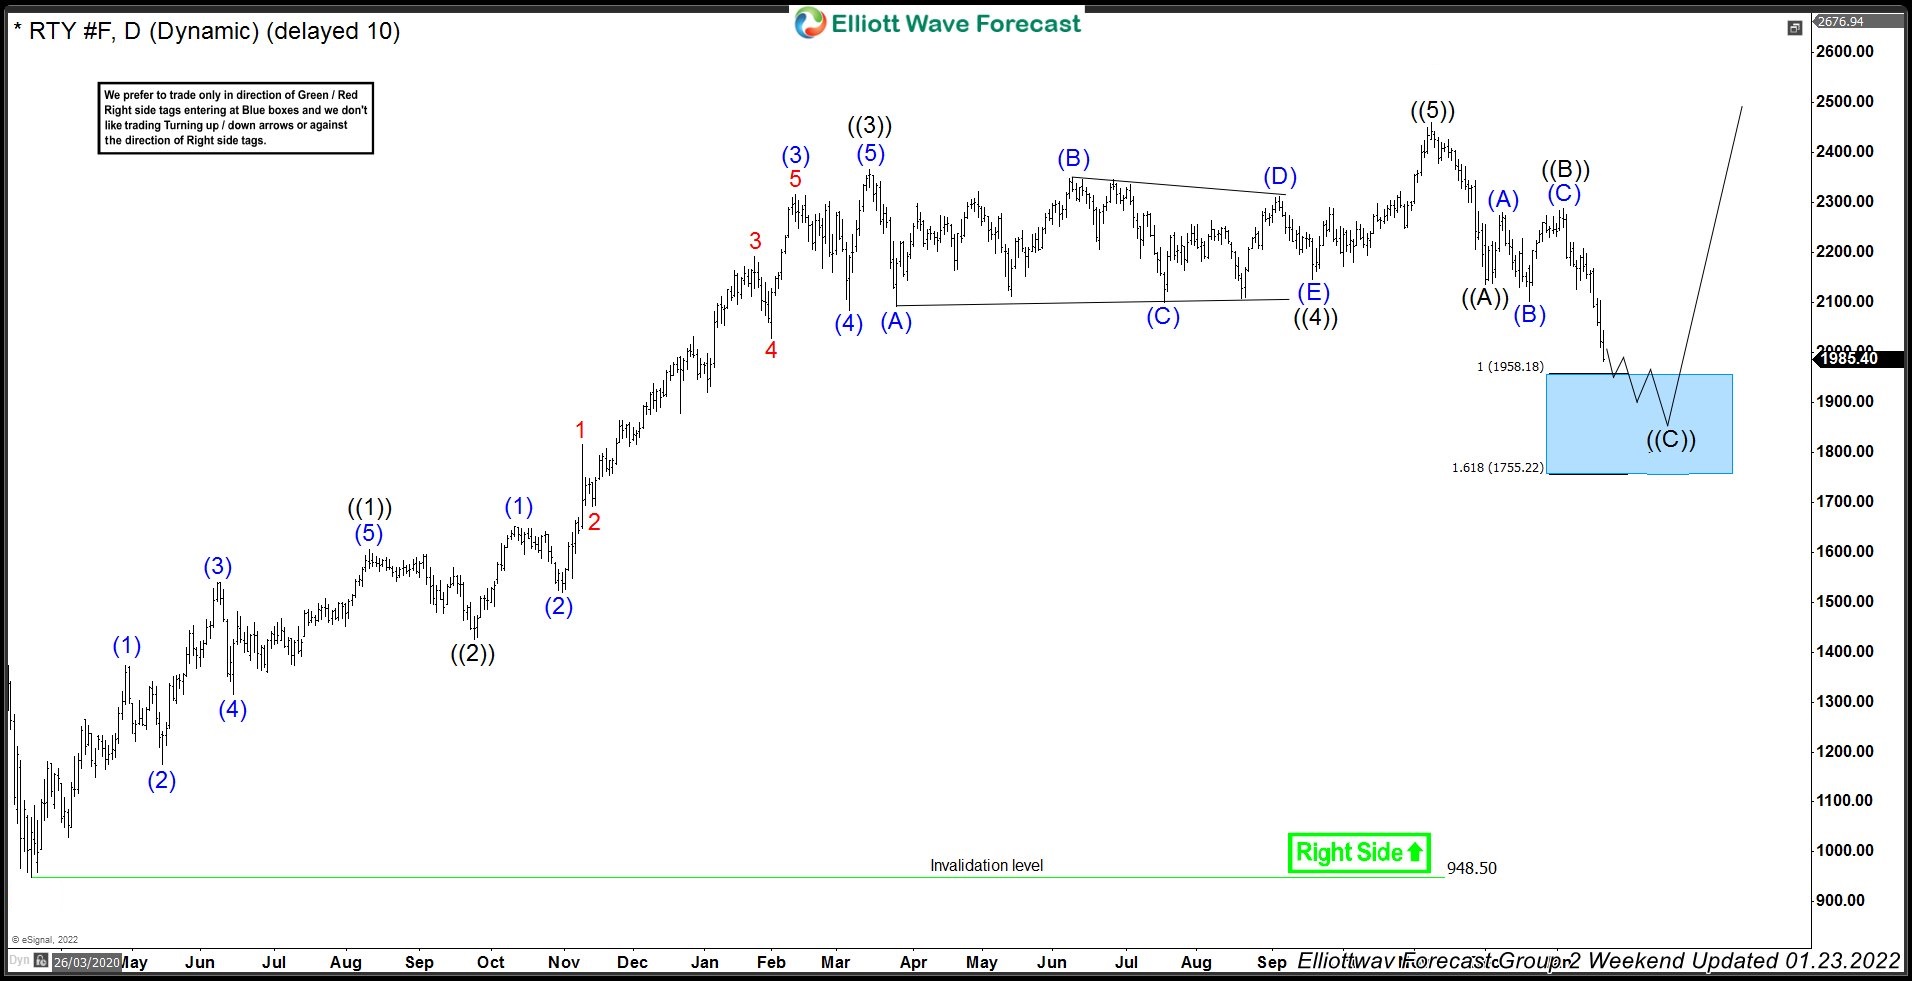
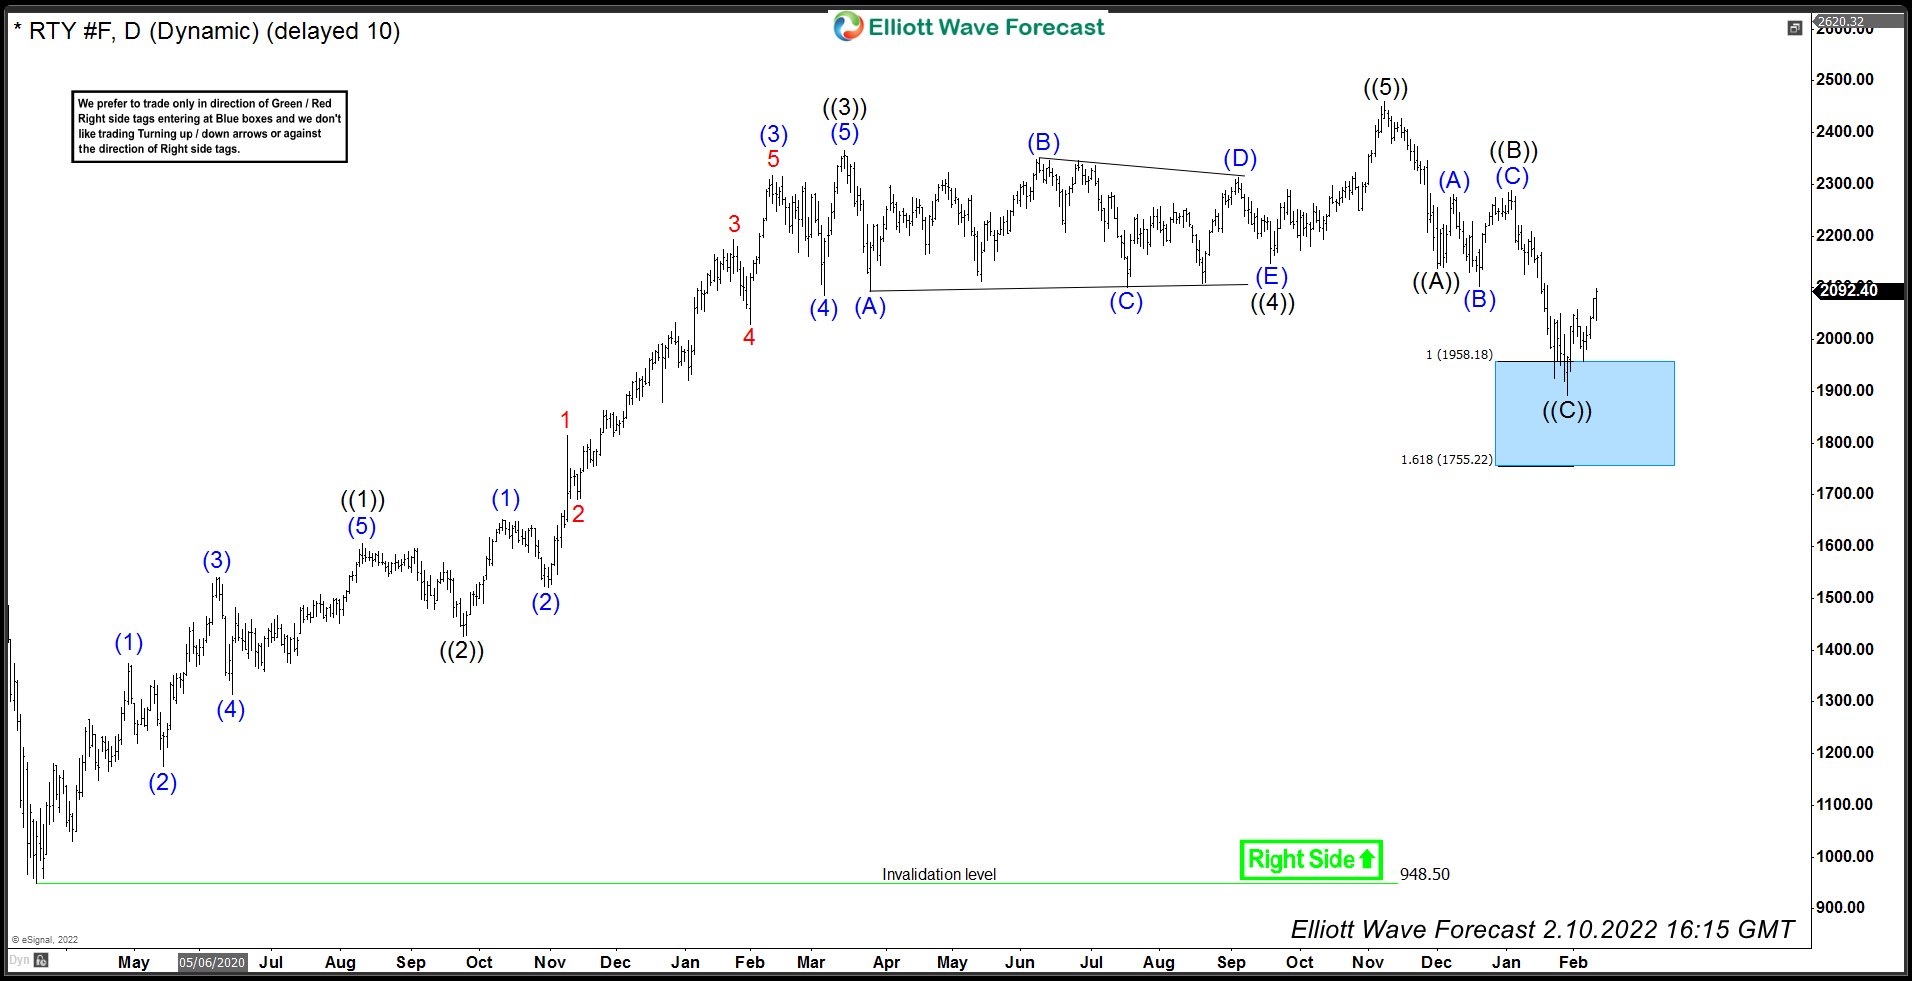
RTY_F made a sharp decline during the month of January 2022. Clients of Elliottwave-Forecast were aware that decline was nothing more than another buying opportunity and our daily chart had the range defined where we expected 3 waves decline to end and buyers to appear to resume the rally or produce 3 waves reaction higher at least.
RTY_F Forecasting The Decline Into Blue Box And Reaction Higher
Stock Market
Get the Elliott Wave Trading Mastery Bundle — Free
100% FreeLearn how to read the markets with more structure using practical guides on:
- Elliott Wave rules and market structure
- Fibonacci levels and price targets
- 3, 7 and 11-swing patterns
- Forex, stocks, ETFs and crypto
- Technical analysis and risk management
Plus, get free market insights, educational emails, and our Chart of the Day to keep building your skills.
Start learning today — no cost, no card required.
Related Articles
Chart Of The DayStock Market
Elliott Wave Outlook: Gold (XAUUSD) Anticipates Minimum 3 Wave Rally
The short-term Elliott Wave view in Gold (XAUUSD) indicates that the cycle from the June...
Chart Of The DayStock Market
Elliott Wave Outlook: Gold Miners ETF (GDX) Zigzag Correction In Progress
Short‑term Elliott Wave analysis in the Gold Miners ETF (GDX) indicates that the cycle from...
Stock Market
XOM Stock Finds Buyers After Elliott Wave Double Three Pattern
Hello, fellow traders. In this technical blog, we’re going to take a quick look at...