Royal Gold (NASDAQ: RGLD) is one of the world’s leading precious metals royalty & stream companies, it’s engaged in the acquisition and management of gold, silver, copper, lead and zinc. The Company was founded in 1991 and currently owns interests on 194 properties in over 20 countries.
Since August 2018, Gold price started rising significantly and last week it managed to break above 2016 peak. In the mean time, RGLD already made an extra swing higher as 2016 was taken last year creating a bullish sequence aiming for a target higher at $123 and with the current higher price of the precious metal, the stock soared to new all time highs making 20% in just 2 months.
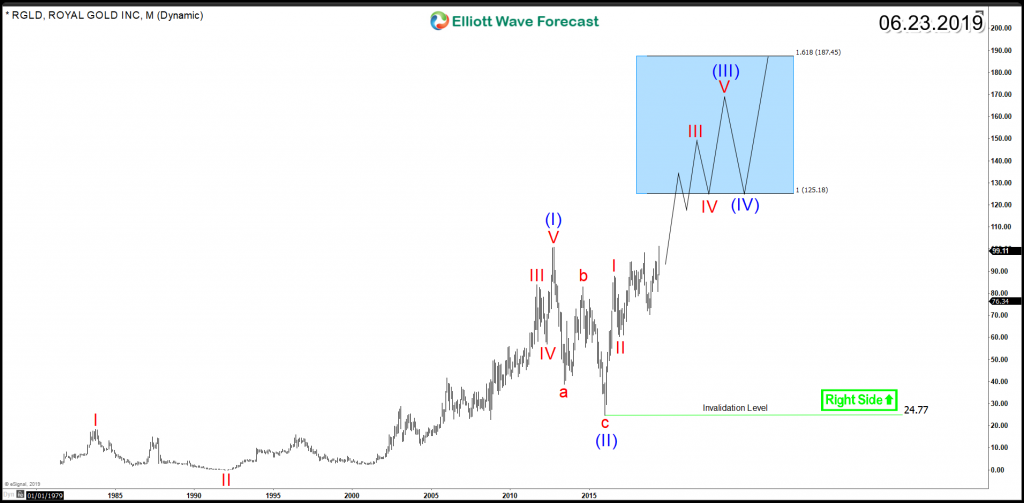
The cycle from all time lows in RGLD is unfolding as an Elliott Wave 5 waves impulsive structure and with the recent move higher it confirmed a new multi-year bullish sequence with a minimum target at $125 and further extension around $187 as the stock is nesting higher in the strongest leg wave (III).
RGLD Monthly Chart 6.23.2019
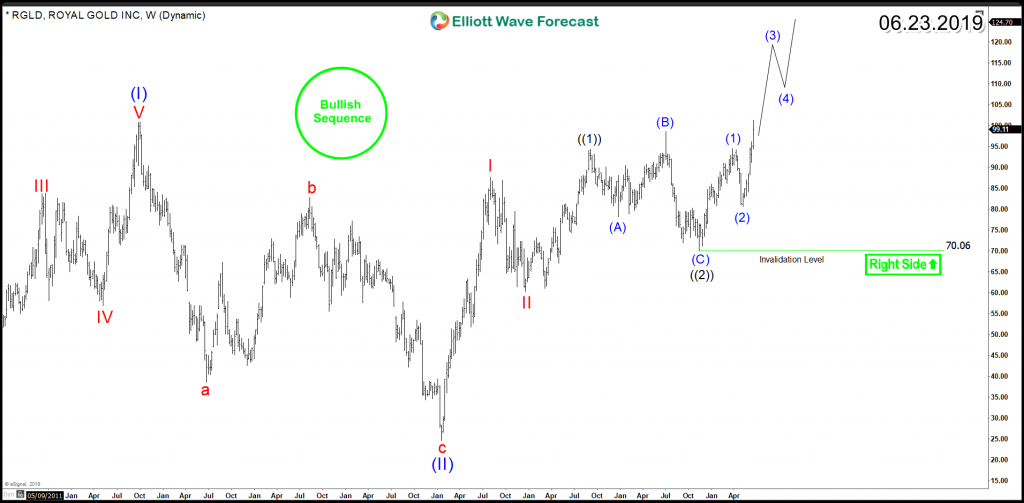
In the recent 2 years, RGLD price action was a little bit tricky as the stock did an Elliott Wave Flat 3 waves correction which ended in November 2018 low before resuming higher and creating a new bullish sequence against June 2019. Consequently the stock is looking to remain supported above $80 in first degree and $70 in second degree as buyers are expected to show up in every pullback in 3, 7 or 11 swings.
RGLD Weekly Chart 6.23.2019
Get more insights about Mining Stocks by trying out our services 14 days to learn how to stay on the right side of the market. You will get access to our 78 instruments updated in 4 different time frames, Live Trading & Analysis Session done by our Expert Analysts every day, 24-hour chat room support and much more.
Back


