Roblox (RBLX) is an online game platform and game creation system developed by Roblox Corporation that allows users to program games and play games created by other users. Created by David Baszucki and Erik Cassel in 2004 and released in 2006, the platform hosts user-created games of multiple genres coded in the programming language Lua.
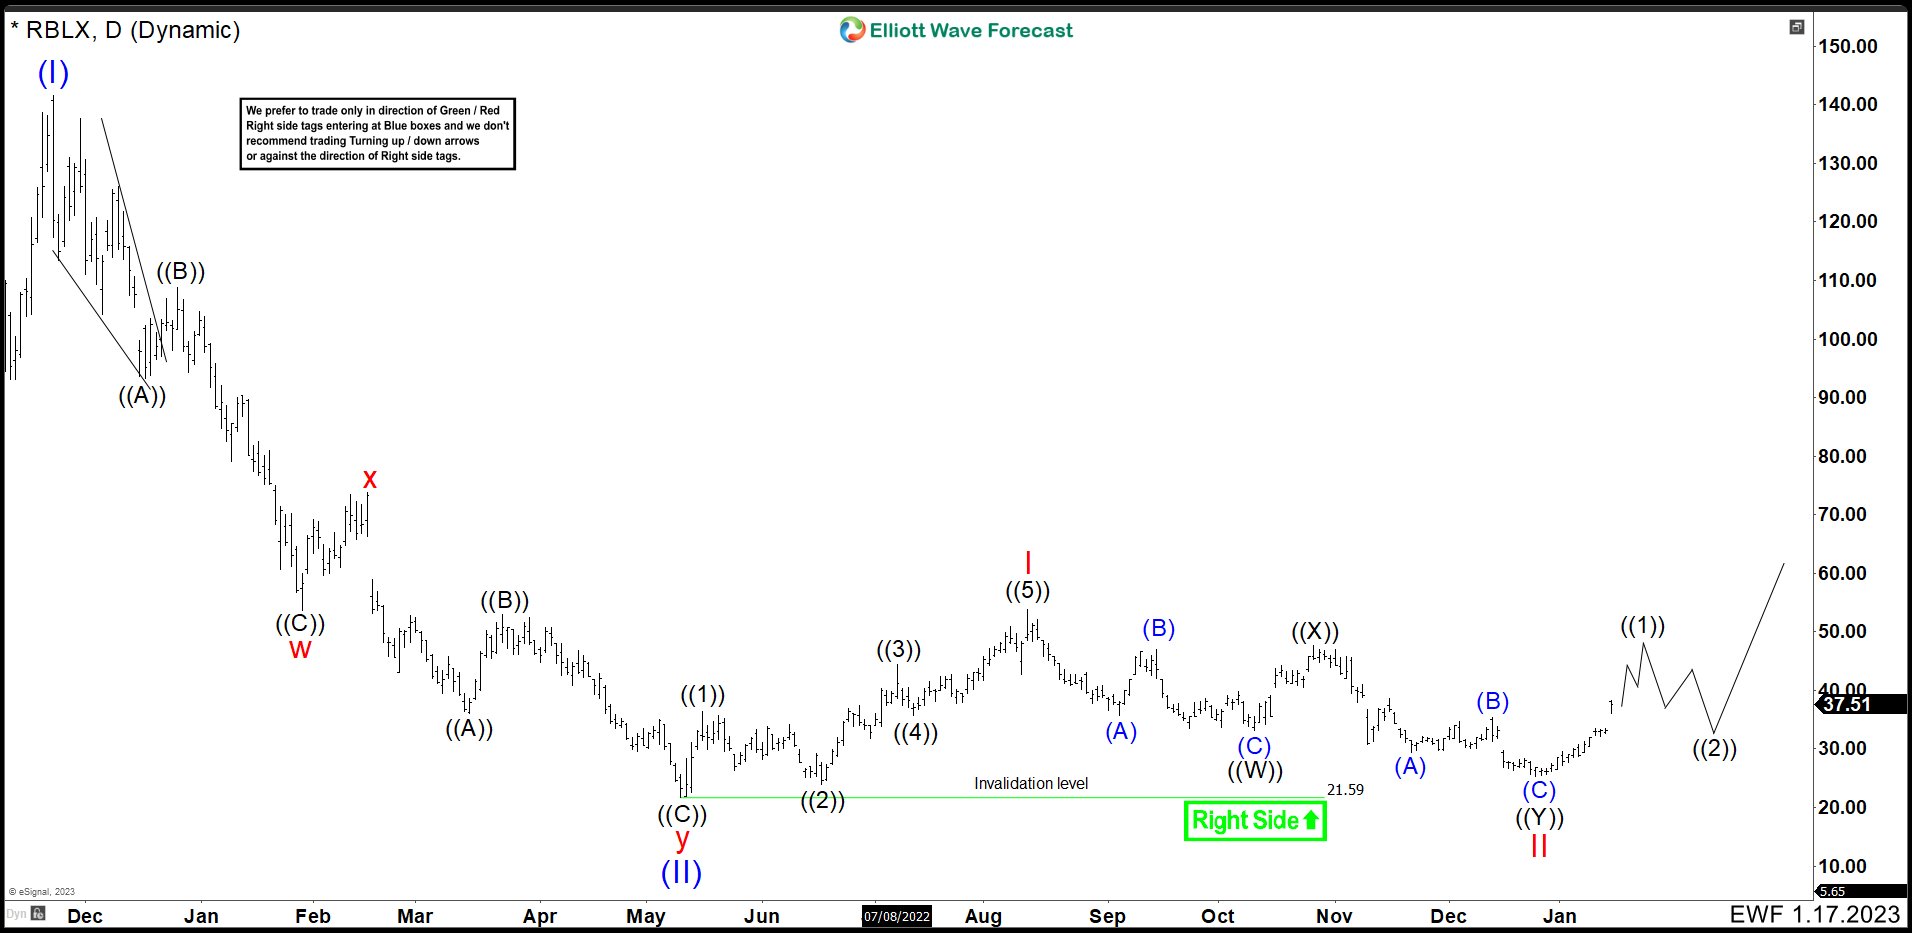
Roblox (RBLX) finished a bullish movement in December 2021. We called that peak wave (I). Then a downtrend started, which developed an Elliott Wave double correction structure ending in May 2022 at $21.50.
RBLX January 2023 Daily Chart
 In January we saw how RBLX bounce took the form of a leading diagonal ending at $53.99. This high we called wave I. Another double correction was formed again. The first 3 waves ended wave ((W)) at $33.08. Then the rally failed at $47.93, so it was the connector ((X)). From there we can see 3 more waves to the downside that completed the double correction and wave ((Y)) of II and wave II at $25.38.
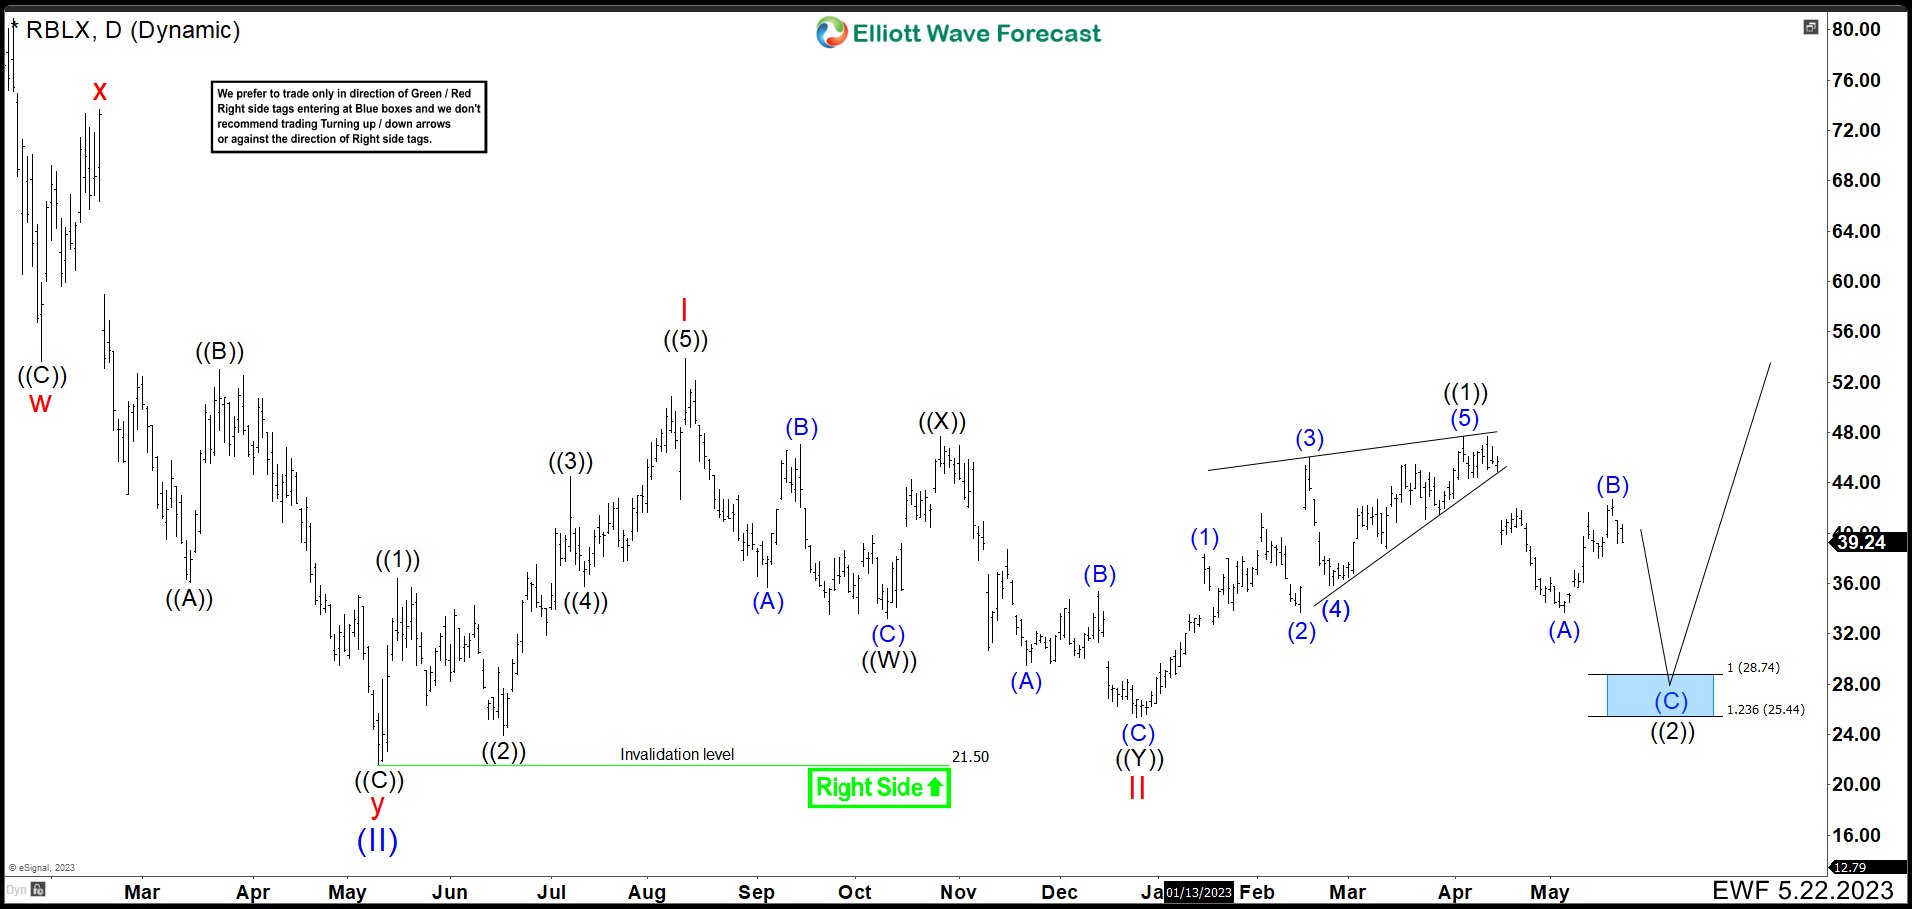
RBLX May 2023 Daily Chart
 In the chart above, we can see how since December 2022 low RBLX again has built a leading diagonal as wave ((1)). The first rally ended the wave (1) at $38.36. Then we had a running flat correction as wave (2) ending at $33.66 and a strong rebound that completed wave (3) at $46.15. The price was rejected very fast dropping to $35.71 ending wave (4). The last swing higher as wave (5) ended at $47.77, completing the leading diagonal structure of ((1)).
The correction started in April and looks like is developing a zig zag structure. Wave (A) of ((2)) finished retesting wave (2) at $33.66. Then corrective bounce as wave (B) completed at $42.73. Currently, we should develop wave (C) of ((2)) lower. As price stays below $47.77 we looking for more downside to complete the correction as wave ((2)). The structure should end in $28.74 – $25.44 area where RBLX should continue with the rally or see 3 swings higher at least. If the market breaks below May 2022 low, it could continue lower to 19.12 – 12.38 area before thinking in a bounce. If you want to learn more about Elliott Wave Theory, please follow these links: Elliott Wave Education and Elliott Wave Theory.
Taking 14 Days Trial
Elliottwave Forecast updates one-hour charts 4 times a day and 4-hour charts once a day for all our 78 instruments (Stocks, ETFs, Indices, Commodities, Forex, Cryptos). We do a daily live session where we guide our clients on the right side of the market. In addition, we have a chat room where our moderators will help you with any questions about the market.
Let’s trial 14 days for only $9.99 here: I want 14 days trial. Cancel Any time at support@elliottwave-forecast.com
Back
