McDonald’s (MCD) stock has faced short-term pressure, dropping about 2% recently, yet its fundamentals remain strong. The company continues to benefit from its global franchising model, which delivers high margins and stable cash flow. Moreover, analysts highlight that despite inflationary challenges, McDonald’s has maintained revenue growth and resilient consumer demand. Transitioning into the next quarter, investors should expect moderate volatility, as forecasts show the price fluctuating between $279 and $336 before stabilizing near $303. This range reflects both inflationary risks and the company’s ability to sustain profitability through menu innovation and operational efficiency.
Looking further ahead, Wall Street maintains a consensus “Hold” rating, with 11 analysts recommending “Buy” and 15 suggesting “Hold”. Importantly, the average price target of $324 implies a 4% upside from current levels, while long-term projections anticipate gradual growth into 2026 and beyond. Therefore, while short-term headwinds may limit sharp gains, McDonald’s remains positioned as a defensive stock in the consumer sector. Investors should watch for upcoming earnings reports and consumer spending trends, as these will likely determine whether MCD consolidates near $300 or begins a gradual climb toward its forecasted targets.
Elliott Wave Outlook: McDonald’s MCD Weekly Chart July 2025
Last time, we noticed that wave (2) unfolded with far more duration than we had expected. At first, we leaned toward a strong bullish continuation, but as the structure matured, we chose to relabel it as a leading diagonal. That adjustment came after we recognized the Dow Jones was likely approaching the end of an impulsive move that had started back in April. With that in mind, we expected McDonald’s (MCD) to rally before giving way to a pullback.
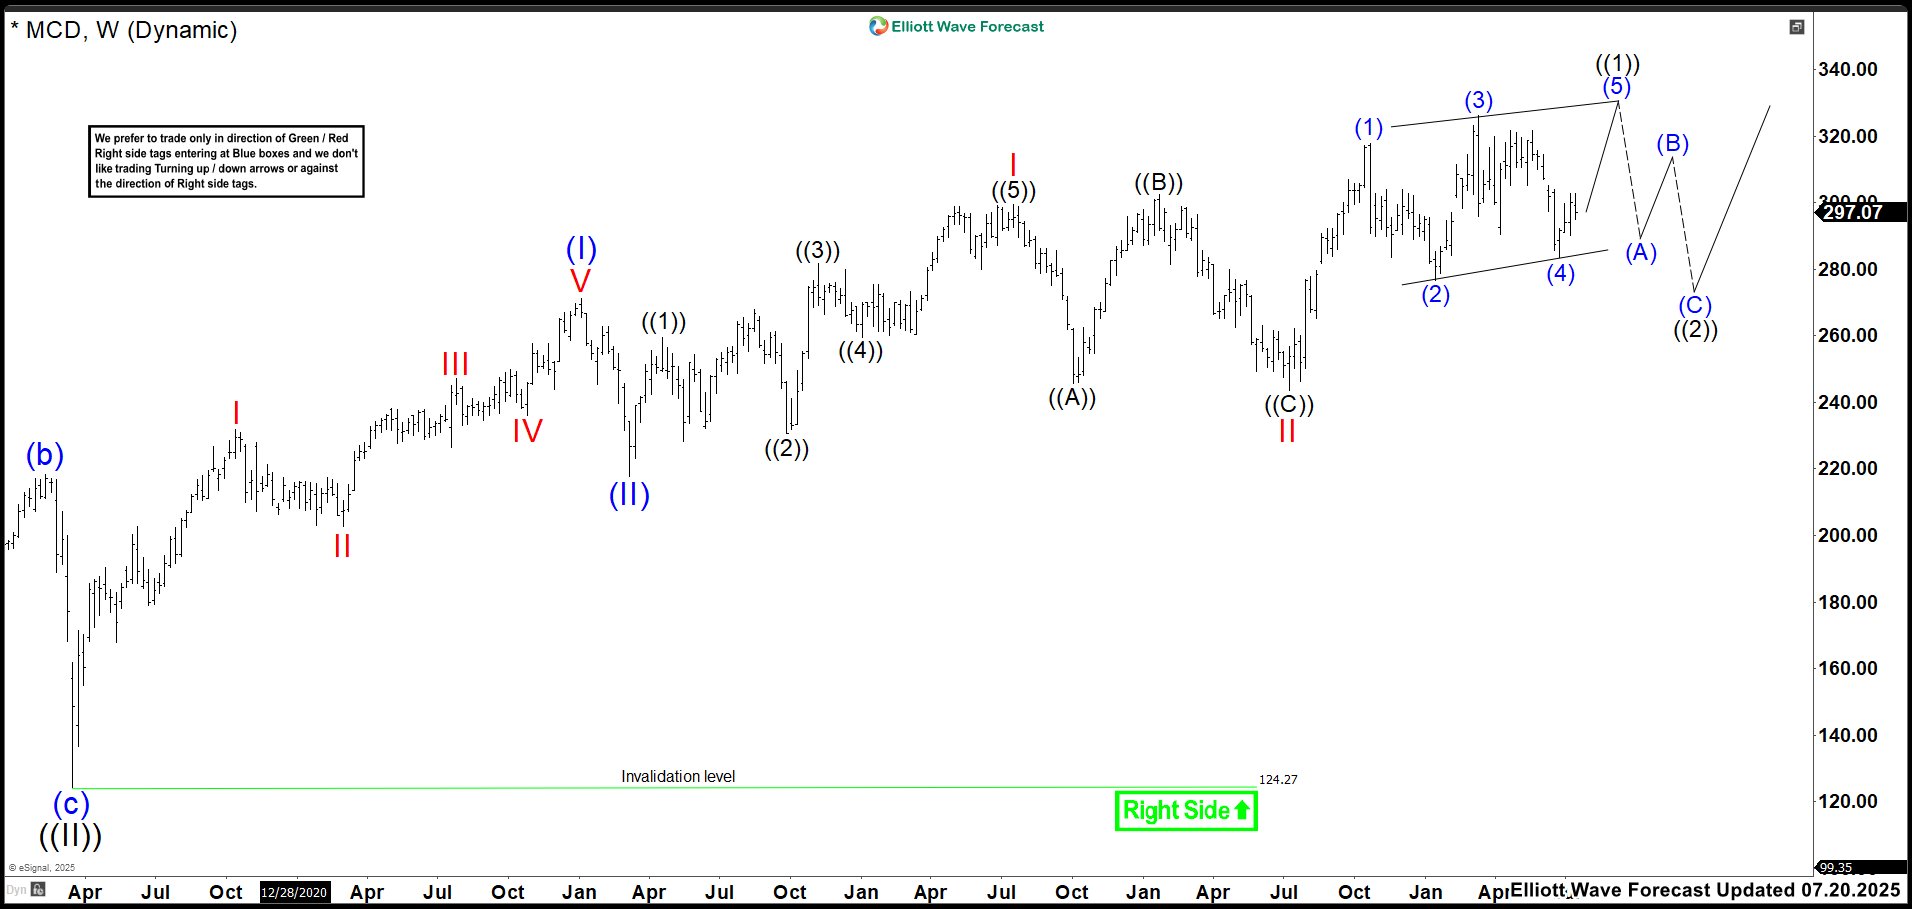
As we mapped the diagonal, we marked wave (1) at the 317.84 high, correction wave (2) at the 276.63 low, the next leg at the 326.27 high, and wave (4) at the 283.47 low. To complete the pattern, we projected wave (5) to rise above wave (3) but remain capped beneath 333.27
If you’d like to deepen your understanding of Elliott Wave Theory, explore these resources: Elliott Wave Education and Elliott Wave Theory
Elliott Wave Outlook: McDonald’s MCD Weekly Chart December 2025

After several months, price action has remained stable without any variation. Consequently, this stability may suggest that the market is forming either a triangle or a bullish nest. We will adopt the triangle scenario, since we still believe the markets are close to completing the April cycle. If this is the case, MCD would bring a correction represented on the chart as wave ((2)).
Meanwhile, because we are still looking one further high to complete wave ((1)), we expect the market to stay above 283.63 low. This level supports our primary idea of aiming for another high around 336.36. Finally, we look for a bearish reaction from the market, which would signal that wave ((1)) may have already ended and announce the beginning of a possible correction.
Transform Your Trading with Elliott Wave Forecast!
Ready to take control of your trading journey? At Elliott Wave Forecast, we provide the tools you need to stay ahead in the market:
✅ Blue Boxes: Stay ahead in the market with fresh 1-hour charts updated four times daily, daily 4-hour charts on 78 instruments. Precise Blue Box zones that highlight high-probability trade setups based on sequences and cycles.
✅ Live Sessions: Join our daily live discussions and stay on the right side of the market.
✅ Real-Time Guidance: Get your questions answered in our interactive chat room with expert moderators.
🔥 Special Cyber Monday Offer: Start your journey with up to $500 off. Gain access to exclusive forecasts and Blue Box trade setups. No risks, cancel anytime by reaching out to us at support@elliottwave-forecast.com.
💡 Don’t wait and get a DISCOUNT for any plan!
Click in the next link, go to Home Chat and ask for a flat discount code saying that you saw this in Luis’ Blog: 🌐
