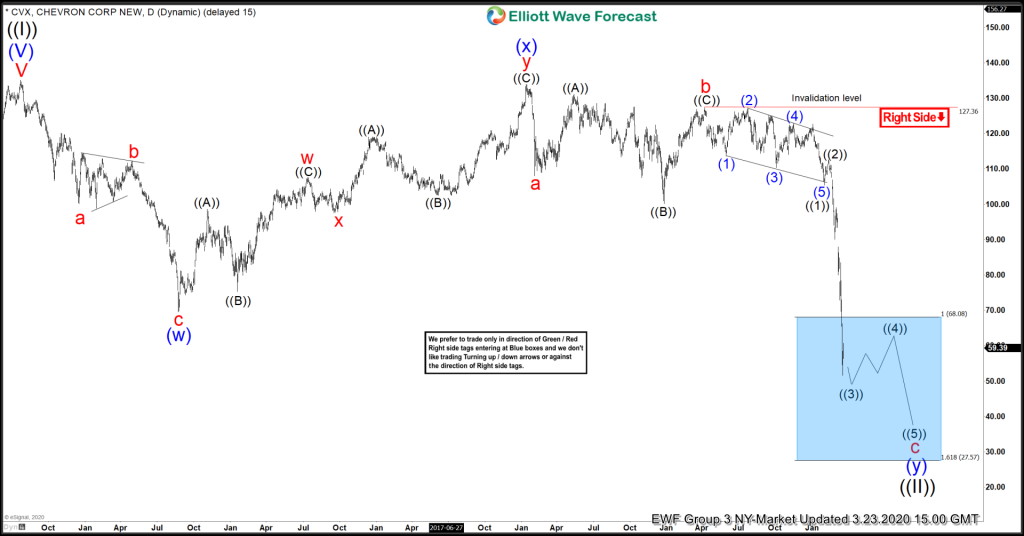
In the heat of the 2020 correction in March 2020, I released a blog titled “Chevron, A Bottom Is Close“. The article featured a blue box area in Chevron where a bounce could take place. Lets take a look at the original chart back in March 2020:
Chevron Elliottwave View March 2020:
At the time, another swing lower was favoured to take place. However, any time an instrument enters into the blue box, it can bounce at any time. Algo’s are programmed to enter at the 100% equal leg blue box, it is an area when buyers and sellers begin to fight for direction. Elliottwave is a great tool, but combined with other forms of analysis (like we do here at EWF), a more reliable system is realized.
Fast forward to today. Lets take a look at what happened to Chevron once it entered into the blue box:
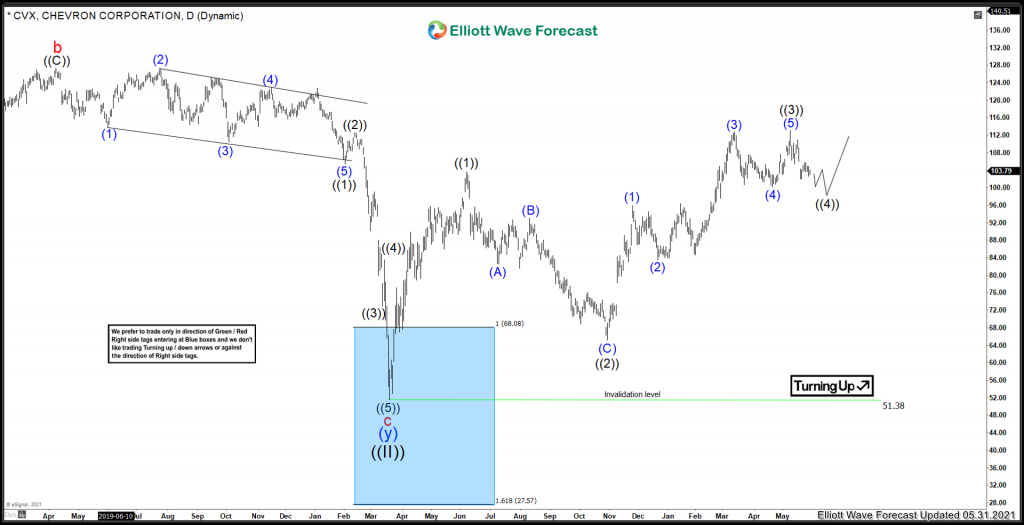
Chevron Elliottwave View May 2021:
As mentioned, at the time in March 2020, the Elliottwave count was favouring more lows to take place. But the Algos stepped up in the blue box and produced a sharp reaction from the low. This marked the correction cycle low, and now a new cycle higher has begun.
Since the March 2020 lows, the count in Chevron is showing that a new impulsive structure has started. ((1)) is favoured to have set at 103.59 on June 8/2020. After that, ((2)) is favoured set @ 65.16 on October 29/2020. From there a rather text book advance has taken place with a well defined wave sequence into the wave ((3)) peak @ 113.11. Currently a wave ((4)) correction is underway. Once ((4)) is complete, the next leg higher can take place before correcting the whole cycle from March 2020 low.
Risk Management
Using proper risk management is absolutely essential when trading or investing in a volatile stocks. Elliott Wave counts can evolve quickly, be sure to have your stops in and define your risk when trading.
Improve your trading success and master Elliott Wave like a pro with our free 14 day trial today. Get free Elliott Wave Analysis on over 70 instruments. Including stocks like GOOGL, TSLA, AAPL, FB, MSFT and many many more.
Back


