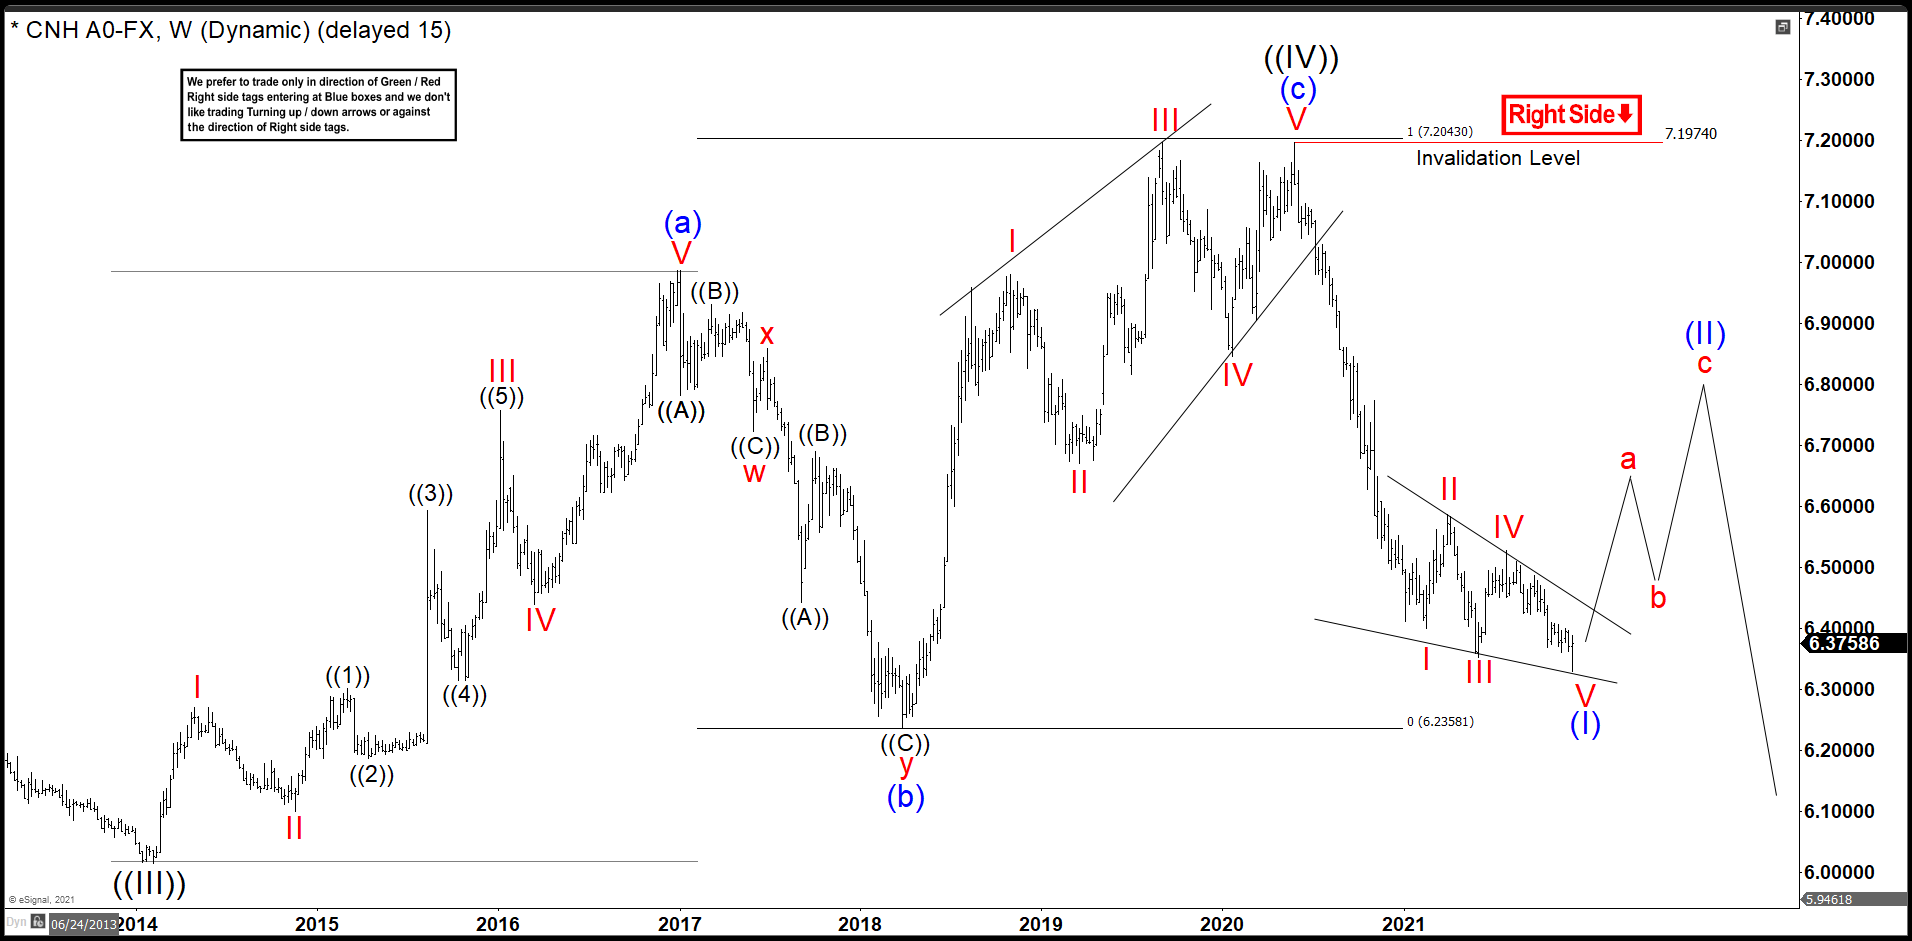
In the last years, the renminbi made a pause in his attempt to get stronger against USD dollar. On February 2014, renminbi found support at 6.0153 and from there it made a perfect zig – zag correction structure to the equal legs 7.1964 in June 2020. After that, the USDCNH continue with the downtrend.
Renminbi Weekly Chart
 The wave (a) began at 6.0153 ending wave I at 6.2710. Pullback wave II finished at 6.1000 getting a strong rally to 6.7315 in 5 swings completing the wave III. Then another correction took place as wave IV ending at 6.4404; as result, a last push made wave V and completed wave (a) almost hit 7.00 dollars at 6.9854. (If you want to learn more about Zig – Zag Structure and Elliott Wave Theory, please follow these links: Elliott Wave Education and Elliott Wave Theory).
After completing 5 waves impulse, we have a huge drop to 6.2359 developing a double correction structure to end wave (b). The volatility did not leave things like that an enormous rally took place in the beginning of wave (c). Wave I of (c) ended at 6.9797 gained almost 12% in 7 months. The next corrective movement a wave II completed at 6.6704 and bounce reached 7.1664, overtaking 7 dollars, to complete wave III. Last correction Wave IV ended at 6.8457 and wave V finished at 7.1974 completing wave (c) as an ending diagonal structure.
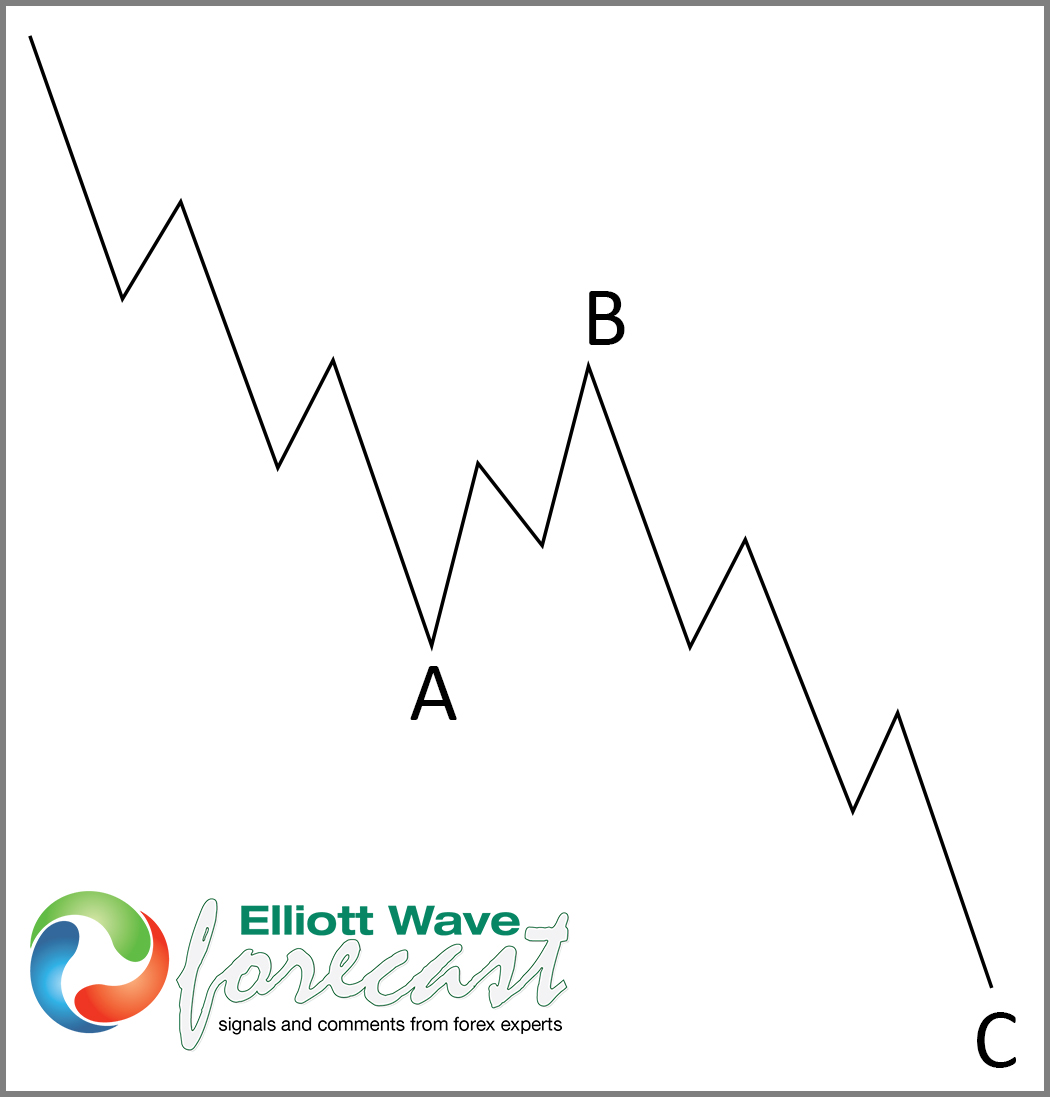
Elliott Wave Theory Zig – Zag Structure
This zig zag structure has taken place, it is telling us that the renminbi should appreciate against the USD in long term. As a correction pattern means the bearish trend must continue. In June 2020, the pair dropped again to 6.3526 and the structure is incomplete to determinate exactly what is the next step for the renminbi. Possible is doing a leading diagonal and that pattern we are drawing in the chart. If that structure plays out we should see a bounce before continue with downtrend. If the leading diagonal does not play out, only one thing is clear, for long term traders the USDCNH, certainly, must break 6.0153 in sometime.
Elliottwave Forecast updates one-hour charts 4 times a day and 4-hour charts once a day for all our 78 instruments. We do a daily live session where we guide our clients on the right side of the market. In addition, we have a chat room where our moderators will help you with any questions you have about what is happening in the market at the moment. Let’s trial 14 days for only $9.99 here: I want 14 days trial. Cancel Anytime.


