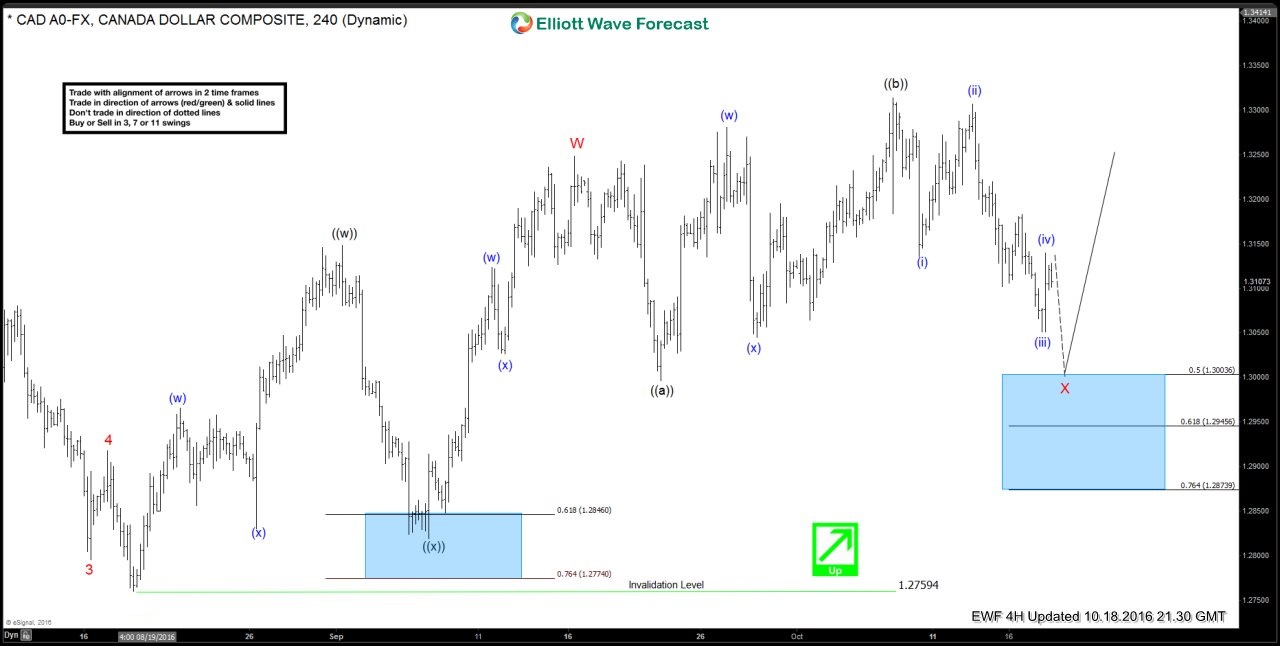
USDCAD The Elliott Wave Forecast theory was developed in the 1930’s and in the theory, the main idea is that the market advances in five waves and corrects in three waves. Since 1930’s, the world has changed a lot now we have computers and we can see multiple instruments and we can measure momentum and many other tools. When the theory was developed, we didn’t have any of these tools and consequently it was developed just based on the charts of few instruments due to the inability of the time and the lack of worldwide economics. We at Elliottwave-Forecast have noticed the suggestive nature of the theory as it was developed and from years of experience, we have tried to incorporate new tools to support the basic rule of the theory we have added momentum reading, swing sequence, time, cycles, correlations and many more tools. In order to use and implement a better use of the theory we do understand that the time has changed and consequently, we are using Elliott wave as a language and applying all the original rules but with a lot of confirmation on top of the theory.
This video explains how we use the swing counts in combination with the RSI momentum indicator to locate the right entry to the market in USDCAD and also determine which sequence was the right Elliott wave structure. As we explained in the video there were many possibilities at the moment but adjusting to the reading of the market we were able to get the right entry. We maintain our view that Elliott wave is suggestive and the trader/ forecaster needs to have an open mind to apply the theory and to be successful in the current market.
We In Elliott wave forecast we offer a 14-day free trial we invite you to take the trial and see our work and how we label a five wave and three waves to see how we always label and trade with an open mind.
USDCAD 4H Analysis 10/18/2016

