Simplifying Elliott Wave Analysis for Traders
One of our goals at Elliottwave-Forecast is to figure out the best way to present Elliott Wave charts in such a way that non-technical traders can easily understand our view and know what they need to do. To this end, we implement the Right Side Tag and Blue Boxes on our charts as visual aids to traders. We believe we have a great system which complement Elliott Wave and improve the objectivity in the analysis. Combined with these two features on our charts, traders can benefit our analysis without having to understand a lot of the details behind the technical charts.
Complementary Technical Tools
In this article, we will talk briefly about what additional tools we use to complement Elliott Wave. We then explain how to trade our Elliott Wave charts easily. The additional technical tools we employ include:
- Pivot system: This is our proprietary system which uses a combination of distribution and some momentum indicators such as RSI, CCI, and Stochastic RSI to determine the cycle position of an instrument. The pivot system can tell us ahead of time whether a cycle has ended.
- Correlation: We strongly believe in the One Market Theory. We believe we shouldn’t forecast an instrument in isolation. Knowing the overall market and different asset classes are important to forecast an instrument more accurately.
- Sequence: We develop our unique sequence technique with corrective sequence unfolding in 3, 7, 11 swing and motive sequence unfolding in 5, 9, 13 swing. The sequence tool helps us to know the right side of the market.
Each technical tool above requires a separate article to talk more in depth. However, it’s not the objective of this article to explain the technical tools above in details. Moreover, traders also do not need to understand them to be able to trade easily using our charts. We do all the rigorous analysis and present our findings on the chart so traders can follow easily. Let’s take a look at the two main features in our Elliott Wave charts:
1. Right Side Tag: Your Trading Compass
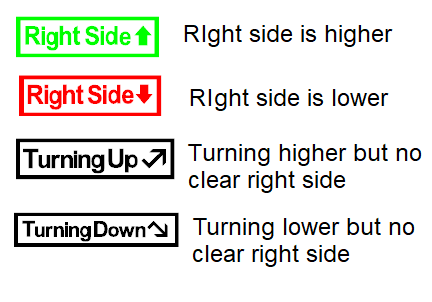
There are four different stamps we use:
Four types of Right Side Tags indicating market direction
The Right Side stamp makes it very clear and easy for traders to execute trade based on our charts. Traders should only buy the dips when the chart shows the right side is higher in green. Traders should not try to sell any pullback even if our chart is calling for it when the right side is higher. Conversely, when the chart shows the right side is lower in red, traders should only attempt to sell rallies. If the right side tag is black in color, this means the right side is not clear. This can be because the instrument is trading sideways or in a choppy manner.
2. Blue Boxes: High-Probability Entry Zones
The blue box is a high frequency inflection area in which the instrument could start turning the other way. It’s the area in which traders can attempt to enter the market in the direction of the right side stamp. For example, if the right side stamp is higher, then traders can attempt to buy pullback in the blue box. For those who would like to know the technical background behind the blue box, it’s based on 100% – 161.8% Fibonacci extension in 3, 7, or 11 swing corrective sequence. However, traders do not need to understand how the blue box is generated in order to trade our charts properly. The blue box is simply the area that traders can execute the trade.
Practical Trading Example: Dow Futures
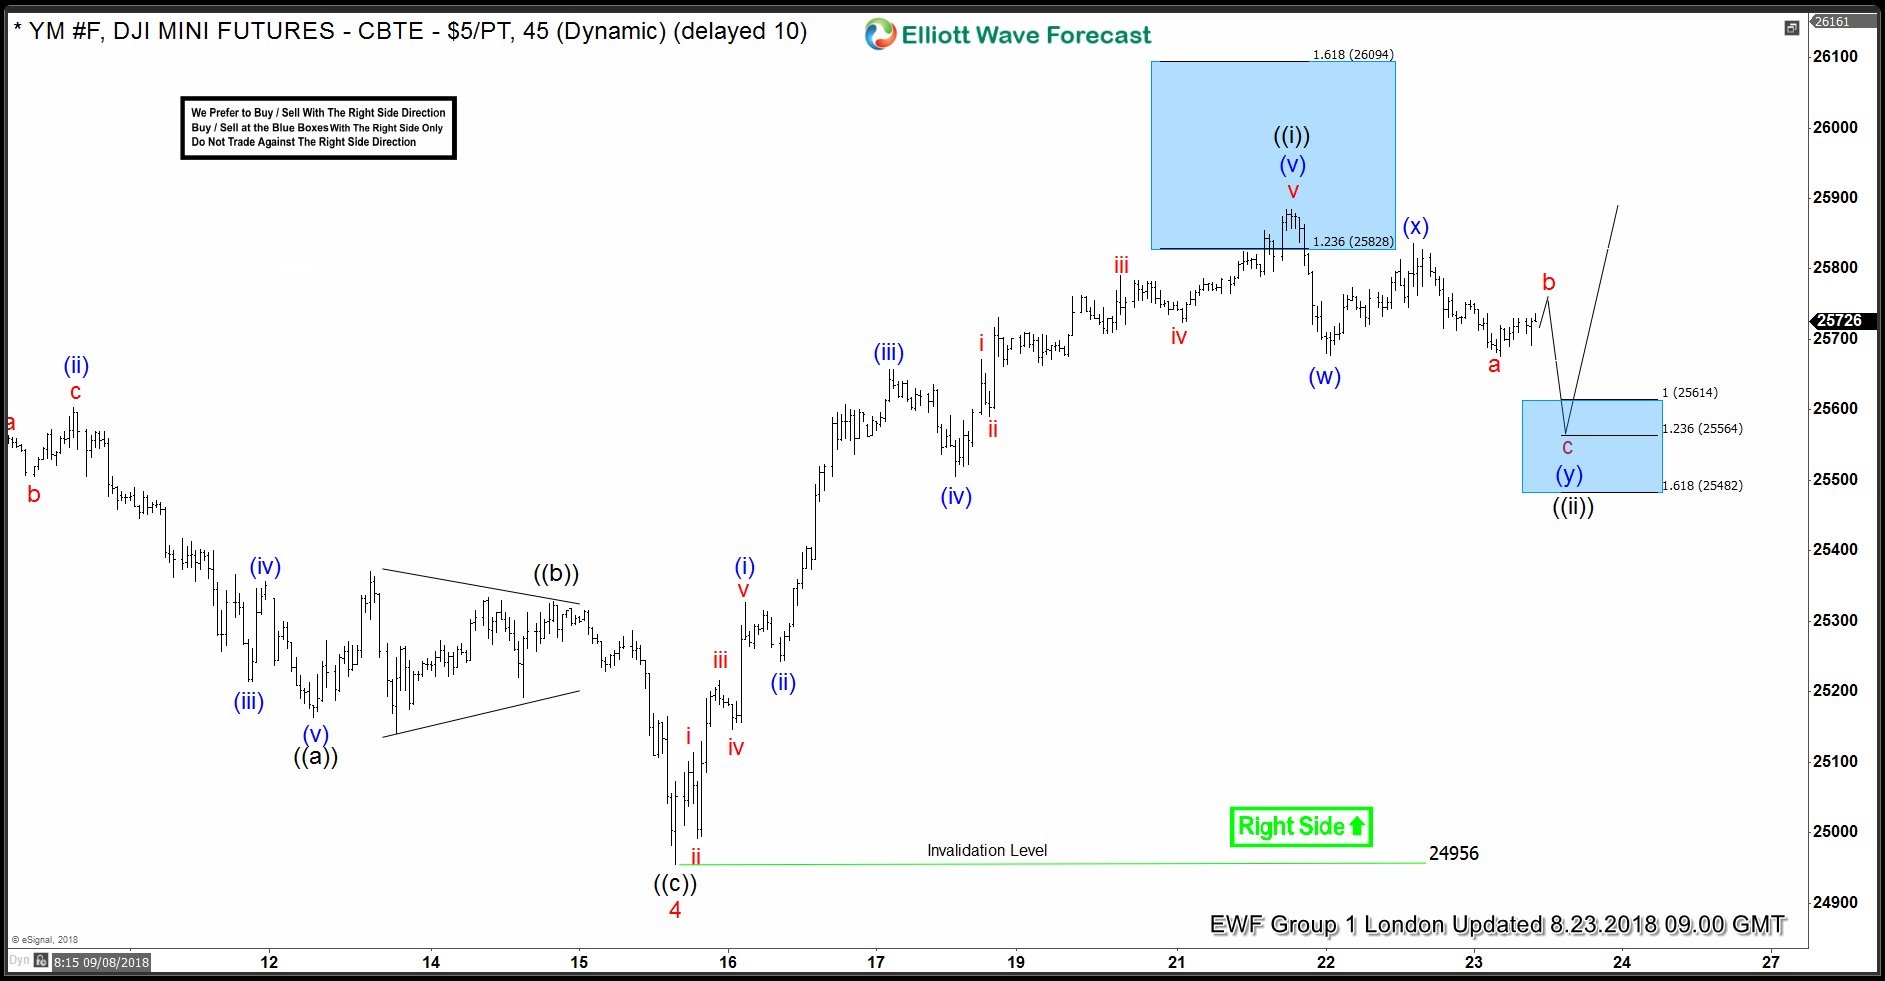
Example of Right Side Higher signal with blue box buy zone in Dow Futures
Let’s use an example on how traders can use the two features in our charts. Please note that these charts are not the latest charts and already outdated. However, they serve as an example on how to trade our charts. Above shows 1 hour chart of Dow Futures (YM_F) per August 23, 2018. The chart shows a clear “Right Side Higher” stamp with invalidation level of 24956. This means traders should not try to sell the Index even if it can extend lower a little bit more. Traders need to buy the dips instead and the blue box is the area in which the turn higher can happen. Thus, traders can look to buy the pullback at 25482 – 25614 (blue box). Traders need to decide themselves the exact level to buy, but we present the area in which we believe pair has a high chance of at least turning higher in 3 waves. Traders also still need to calculate position size carefully when entering into trade in blue box with stop loss below the lower end of the blue box and risk is limited to maximum 2% of capital.
Below is how the Index has performed since then
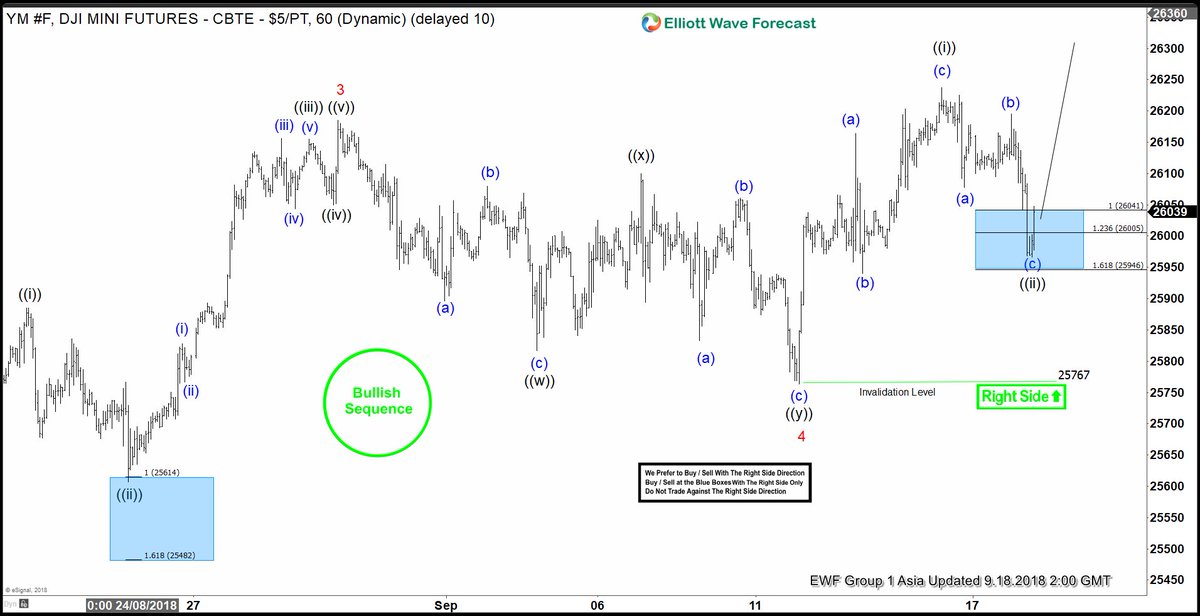
Successful trade outcome from blue box entry in Dow Futures
Index reached the upper level of the blue box (25614) and then resumes higher as expected. Traders who follow our charts and buy at the blue box now should move stop loss to entry level and have a risk free trade. The chart above per Sept 18 in fact gave traders another opportunity to buy the dips. The Right Side stamp is still showing higher with invalidation level at 25767. Traders can buy at blue box at 25946 – 26041.
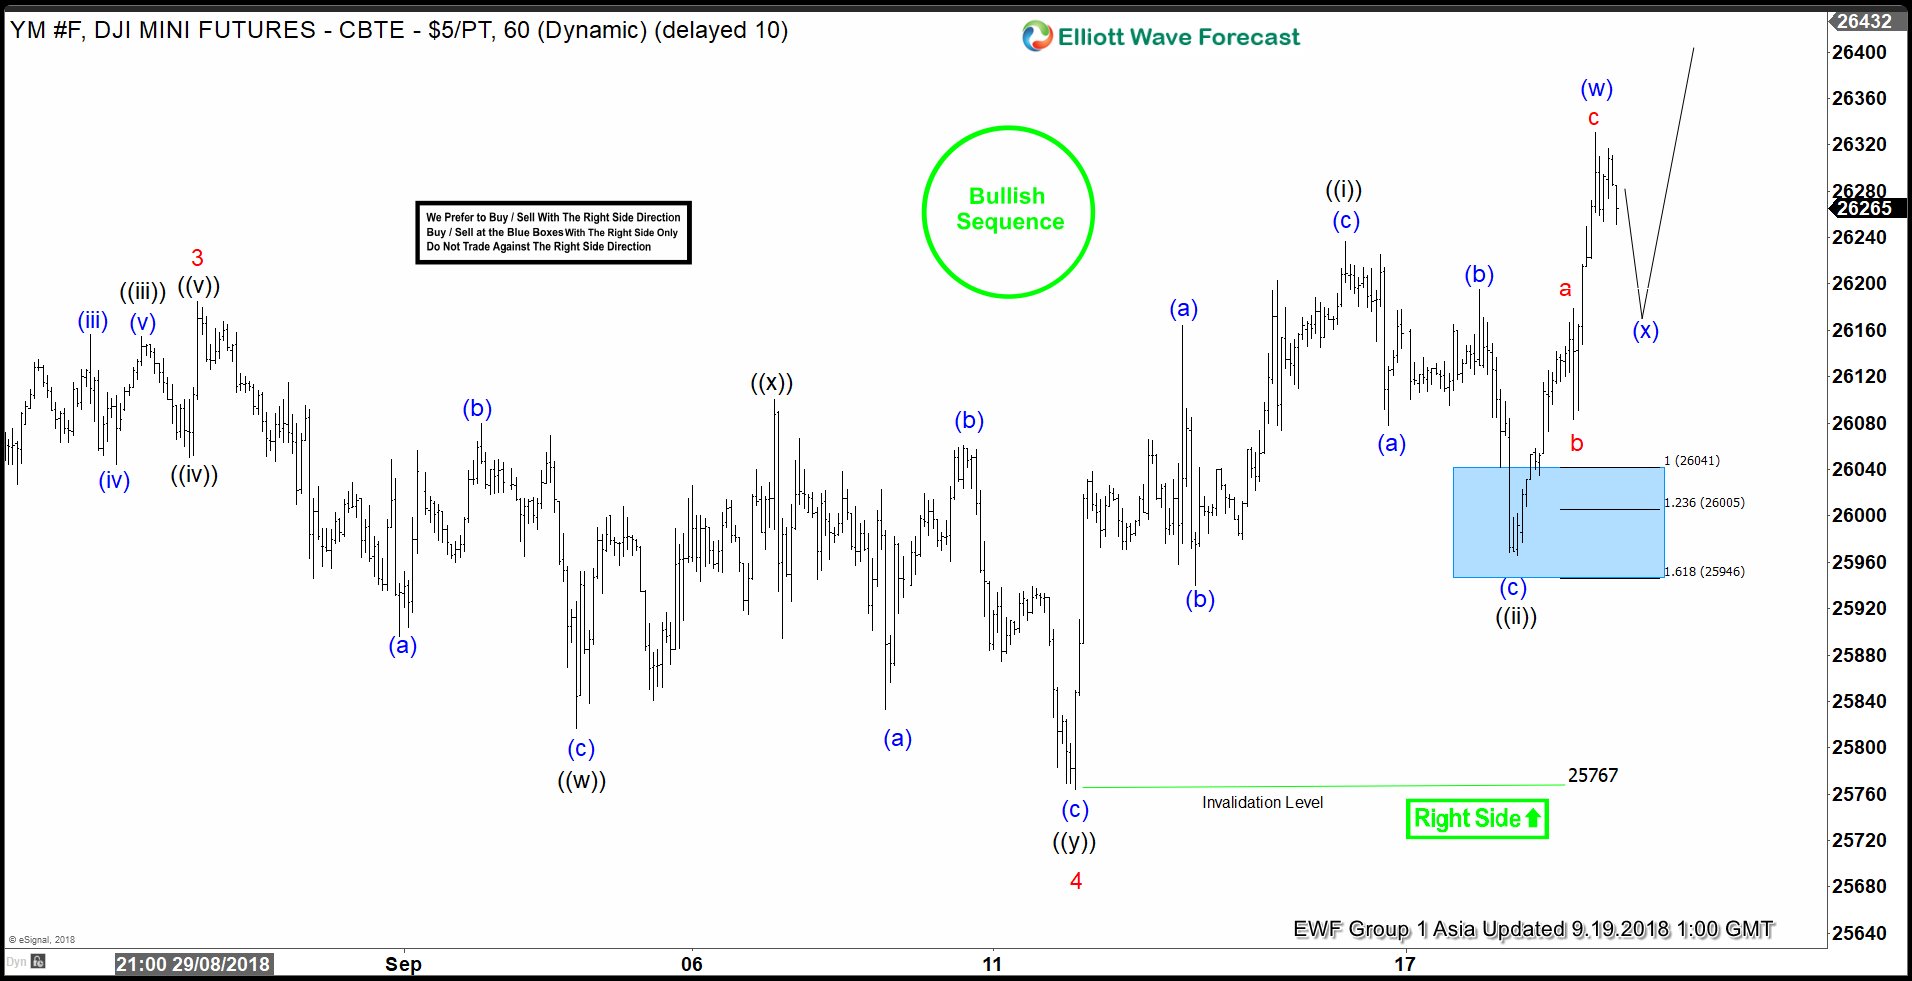
Now let’s take a look at the latest chart in Dow Futures as of Sept 19, 2018
The Index again rallies to new high upon reaching the blue box with Right Side higher. Traders who bought at the blue box therefore already have a risk free trade (stop at break even). Traders will have at least two chances to buy the dips using our charts.
Regardless how long you have been trading and how knowledgeable you are in technical trading, it’s easy to trade using our charts. Just trade following the right side tag, enter at the blue box, and apply proper risk management by calculating position size to stay within 1-2% risk. If you want to learn more about our services, welcome to try our 14 days Trial here –> I want to get my 14 days FEE Trial


