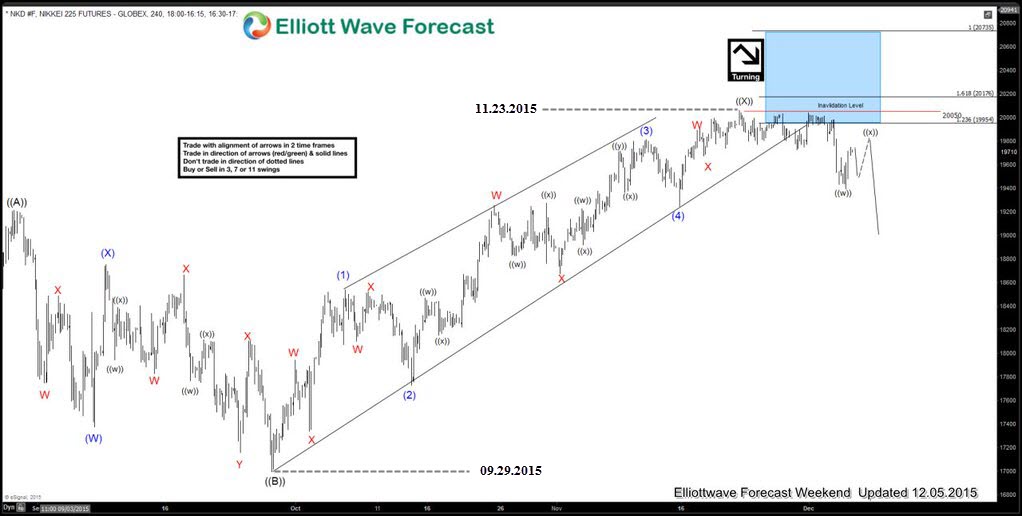
Nikkei 240 minute chart below shows the move up from September 29 2015 ( 16995 low) was a choppy and overlapping structure which showed a lot of contraction as well (see converging trend line connecting price highs and lows). We could also count 11 swings from the low to the high with momentum (RSI) divergence at the highs which made the perfect case for an Ending Diagonal structure.
Taking a step back we could see the drop into September 29 lows was a 3 wave move and it was not followed by most other World Indices , this combined with the fact that move up from 16995 low was a Diagonal structure, made the perfect case for an Expanded FLAT pattern which meant if the analysis was correct, we should get new lows below September 29 2015 lows.
As $Nikkei had been already in the extreme 1.236-1.618 Fibonacci extension area from September 24 2015 (17170 low) and showing a sub-division of 3-3-3-3-3 sequence with momentum (RSI) divergence at the peak, break below diagonal’s lower trend line was needed to confirm the end of the Ending Diagonal structure. This break occurred on 30th November marking the end of Endign Diagonal and possibly Expanded FLAT pattern as well and hence making the Index bearish against 20050 high in the firsts degree. Therefore, it offered a low risk selling opportunities for traders, looking for fresh new lows below 17170 targeting 16309-15439 area.
At the chart below you can see our H4 Weekend Forecast from the 12/05.2015 date.
Experienced Elliott Wave practitioners will probably recognize Expanded Flat Pattern and Ending Diagonal at the chart above, but for those traders who are not familiar with the pattern we advice to read the rest of the blog in order to learn more about the structure.
Before we continue, short reminder: check out New EWF blogs and Free Elliott Wave charts.
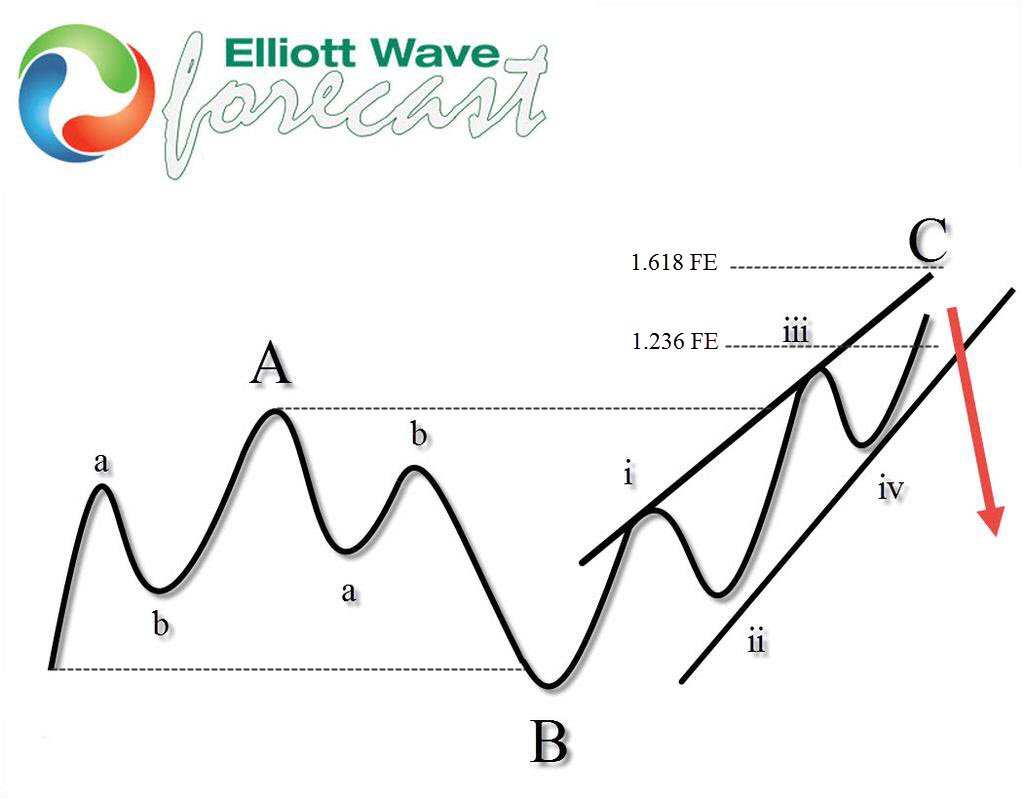
Expanded Flat is a corrective pattern which inner subdivision is labeled as A,B,C. Waves A and B have forms of corrective structures,while third wave C is always 5 waves structure, either motive impulse or ending diagonal pattern. In Expanded Flat Pattern wave B completes below the start point of wave A, and wave C ends above the end point of wave A which makes it Expanded. Wave C of expanded flat usually completes at 1.236-1.618 fibonacci extension A related to B.
At the graphic below, we can see what Expanded Flat structure looks like.
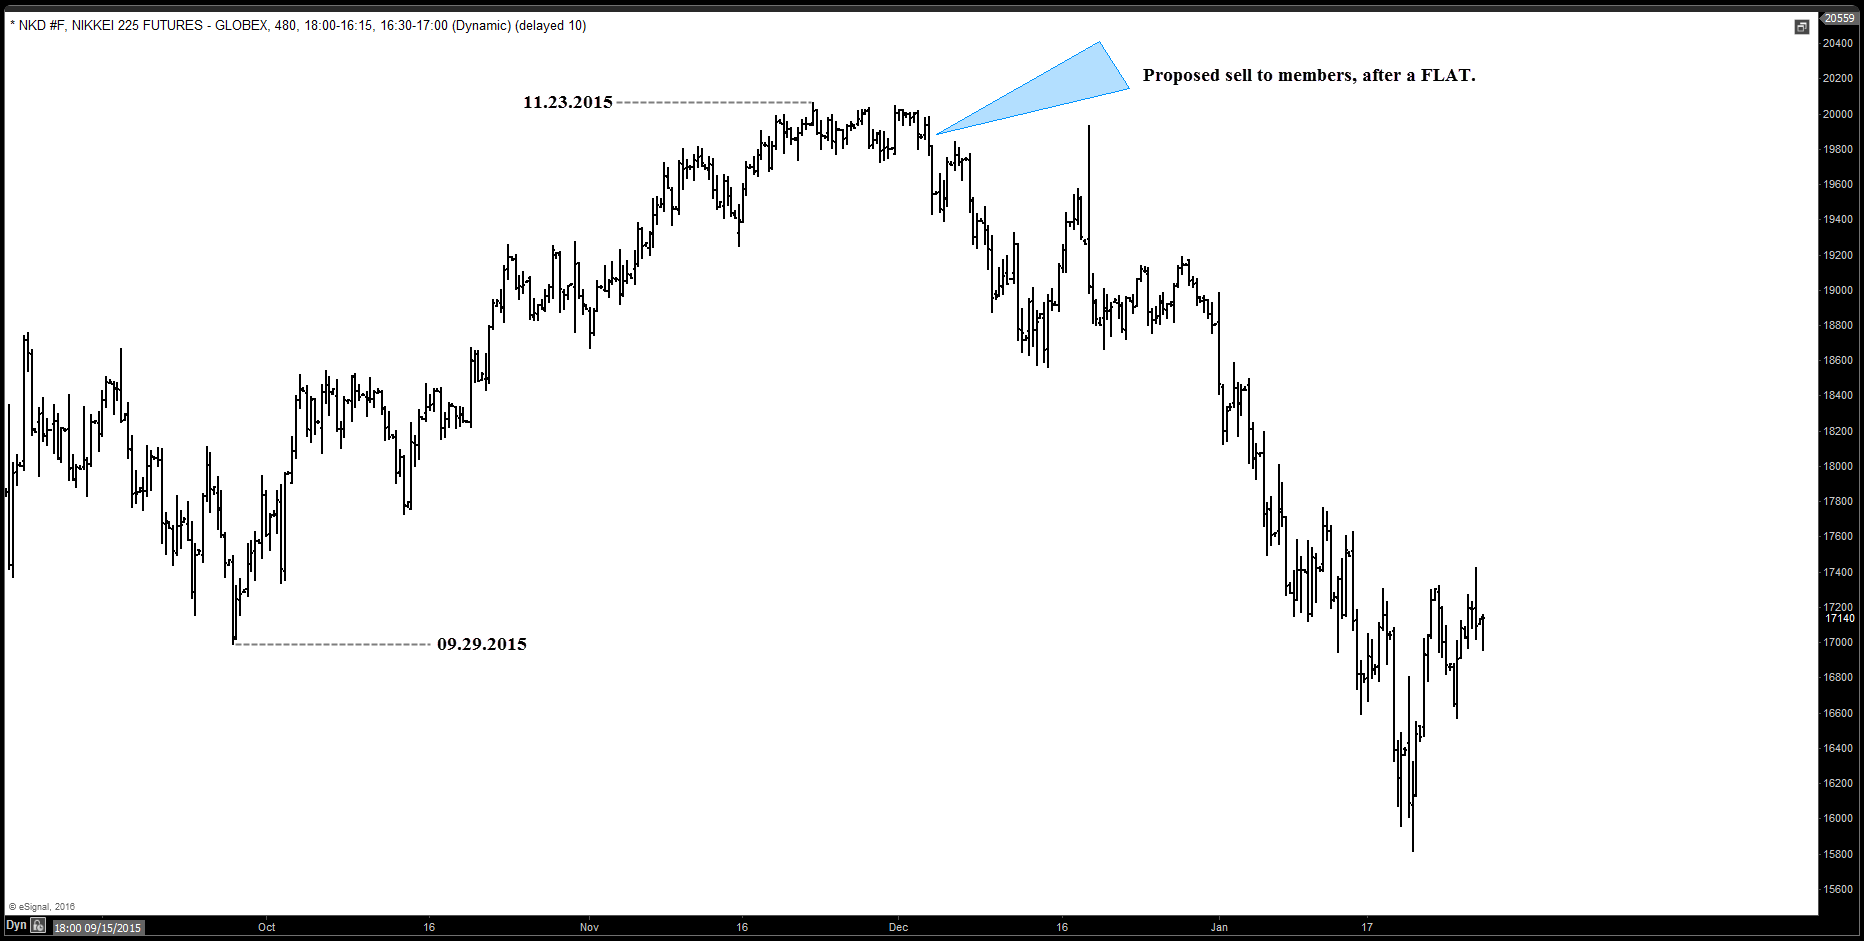
$Nikkei held the 20050 high nicely and gave us decline as expected. Target area has been reached at 16309-15439 and now the Index is bouncing from there. Further path could be found in membership area of EWF.
Proper Elliott Wave counting is crucial in order to be a successful trader. If you want to learn more on how to implement Elliott Wave Theory in your trading and to learn more about next trading opportunities in the Market, try us free for 14 days. You will get access to Professional Elliott Wave analysis in 4 different time frames, Daily Elliott Wave Setup Videos ,Live Trading Room and 2 live Analysis Session done by our Expert Analysts every day, 24 hour chat room support, market overview, weekly technical videos and much more…
If you are not member yet, use this opportunity and sign up now to get your Free 14 days Premium Plus Trial.
For any questioning, feel free to contact me through e-mail vlada@elliottwave-forecast.com or in Twitter.
Welcome to Elliott Wave Forecast !
Back


