At EWF we are not just a market forecasting service, we also try to guide our clients to trade on the right side of the markets. And if our 24 hour chatroom, technical videos, live analysis sessions, live trading room, educational videos and market reports are not enough to help traders succeed, we also added Green and Red boxes on our charts which represent buying (green) and selling (red) extremes in our system. Extreme is a trading situation that EWF developed where market is technically tired in one particular cycle and from that extreme it could renew the trend or react at least in 3 waves. These Green/Red boxes are areas where we expect a high probability trade can happen and it makes it simpler for our clients to know what area we prefer to enter the buy or sell trade with winning or the misery attitude. Like always, some setups would fail as well but these Green / Red boxes would produce a favorable reaction in the anticipated direction majority of the times which allows traders to get into a risk free position (eliminate risk on the trade) and then it’s winning or break-even, no misery.
Let’s take a look at a recent extreme setup in NG #F (Natural Gas commodity) and see how it unfolded
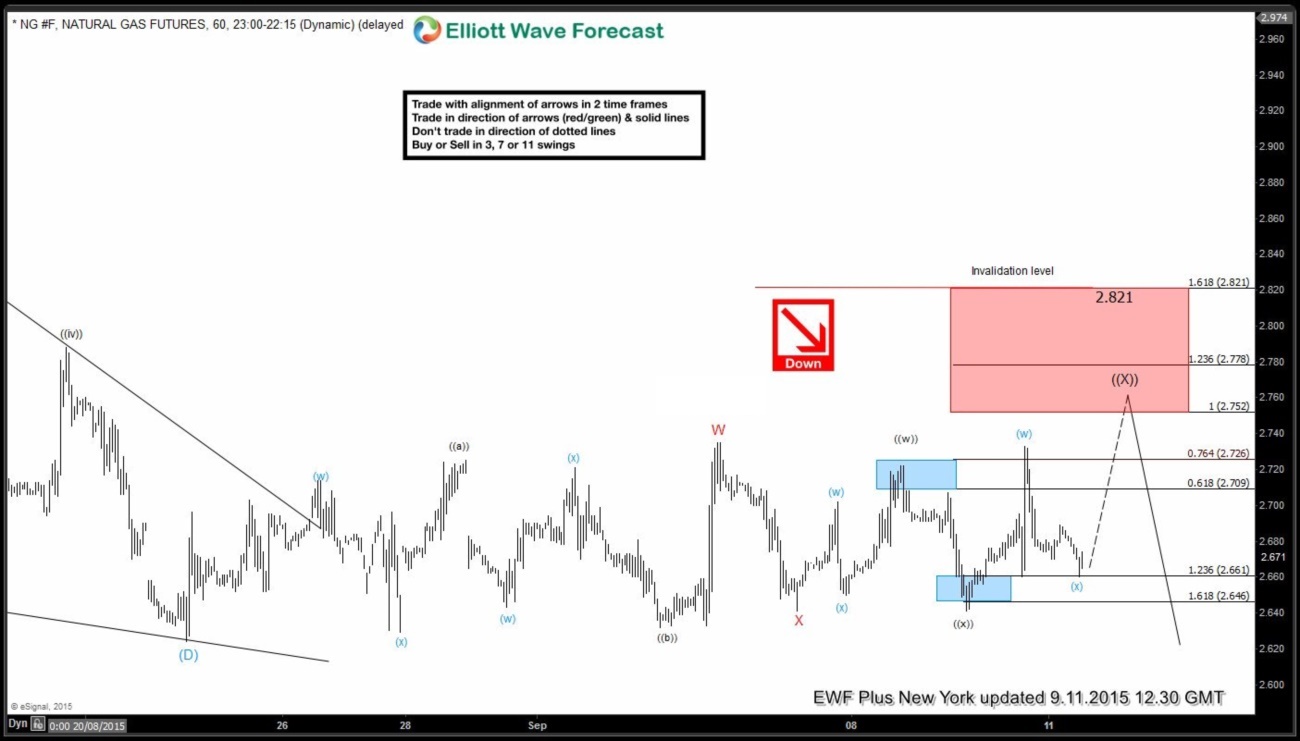
NG #F H1 NY Update 9.11.2015
Market is trapped in sideways consolidation but while above ((x)) low, we are still expecting another push higher toward 2.752 – 2.778 area before prices turn lower again. We liked to wait for aforementioned extreme to be reached before selling the instrument
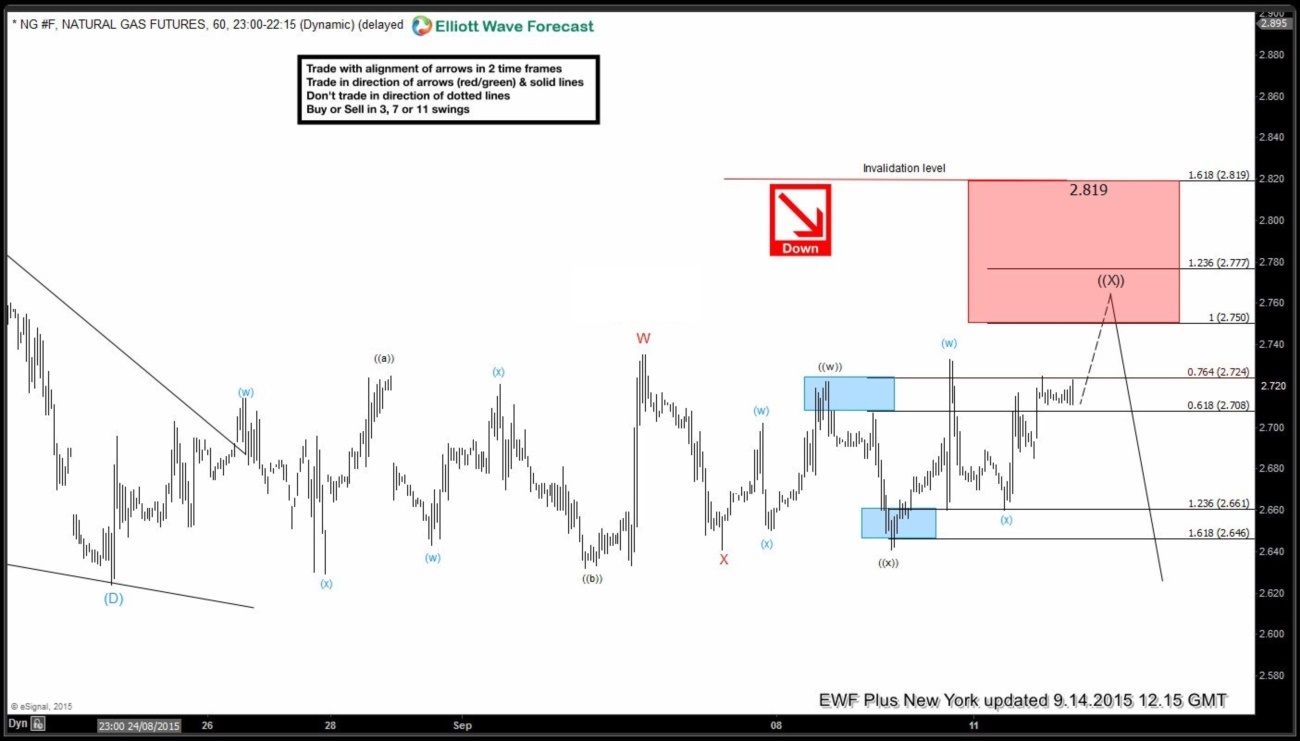
NG #F H1 NY Update 9.14.2015
Price is pushing higher as expected and getting close to reaching the extreme (red box) where we liked to be sellers.
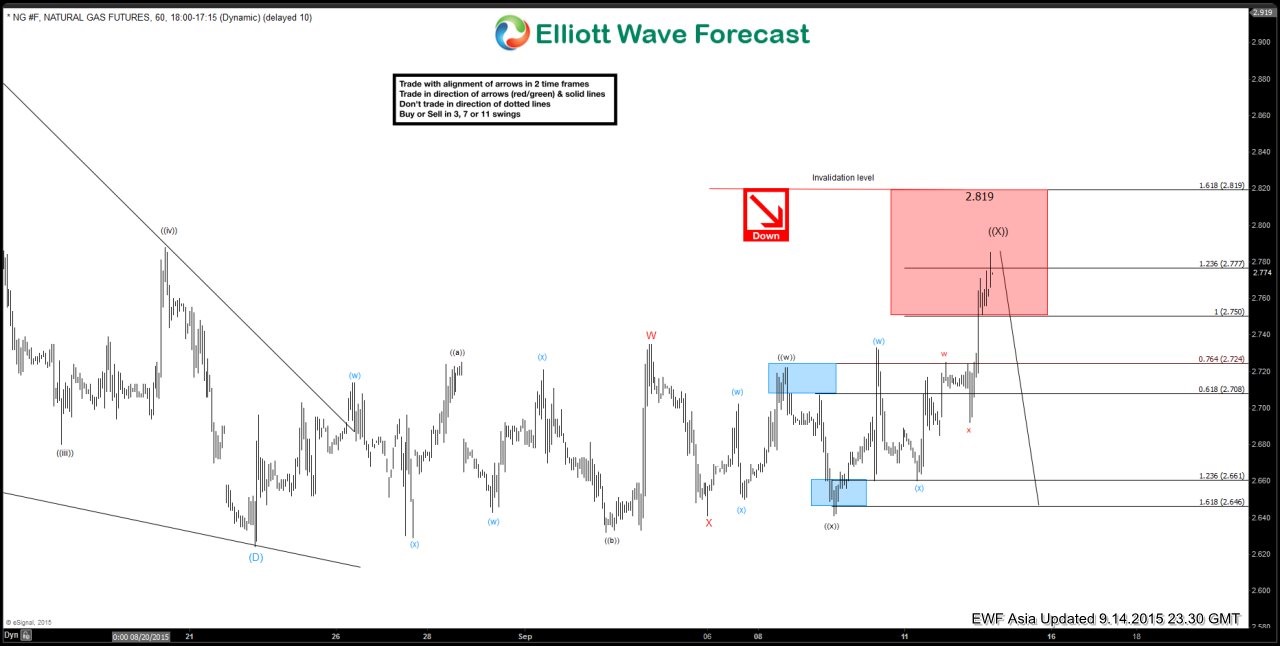
NG #F H1 Asia Update 9.14.2015
Price has reached the extreme (red box), we liked selling the instrument in the red box and expected price to stay below 2.819 high for new lows or a 3 wave reaction lower at least to allow us to create a risk free position.
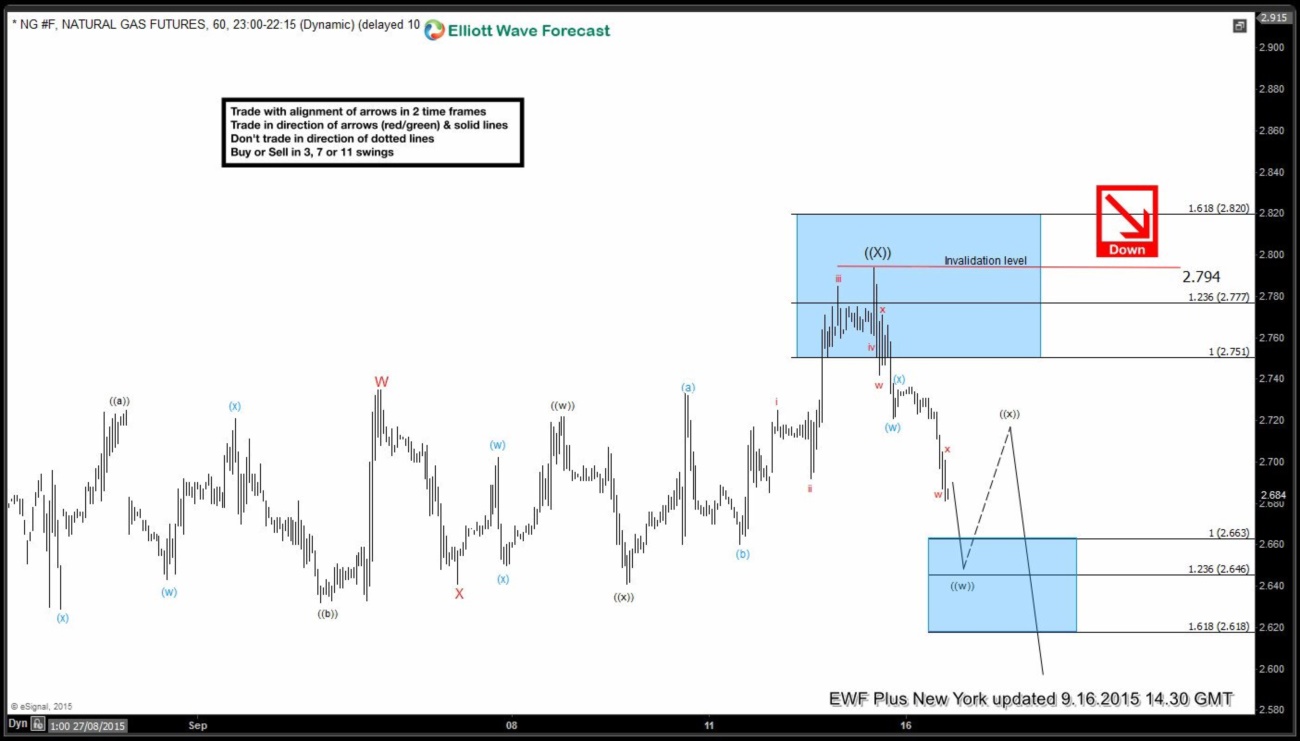
NG #F H1 NY Update 9.16.2015
Sellers appeared in the red box as expected, we have seen the desired reaction lower and created separation from 2.794 high which we thought was enough to create risk free position.
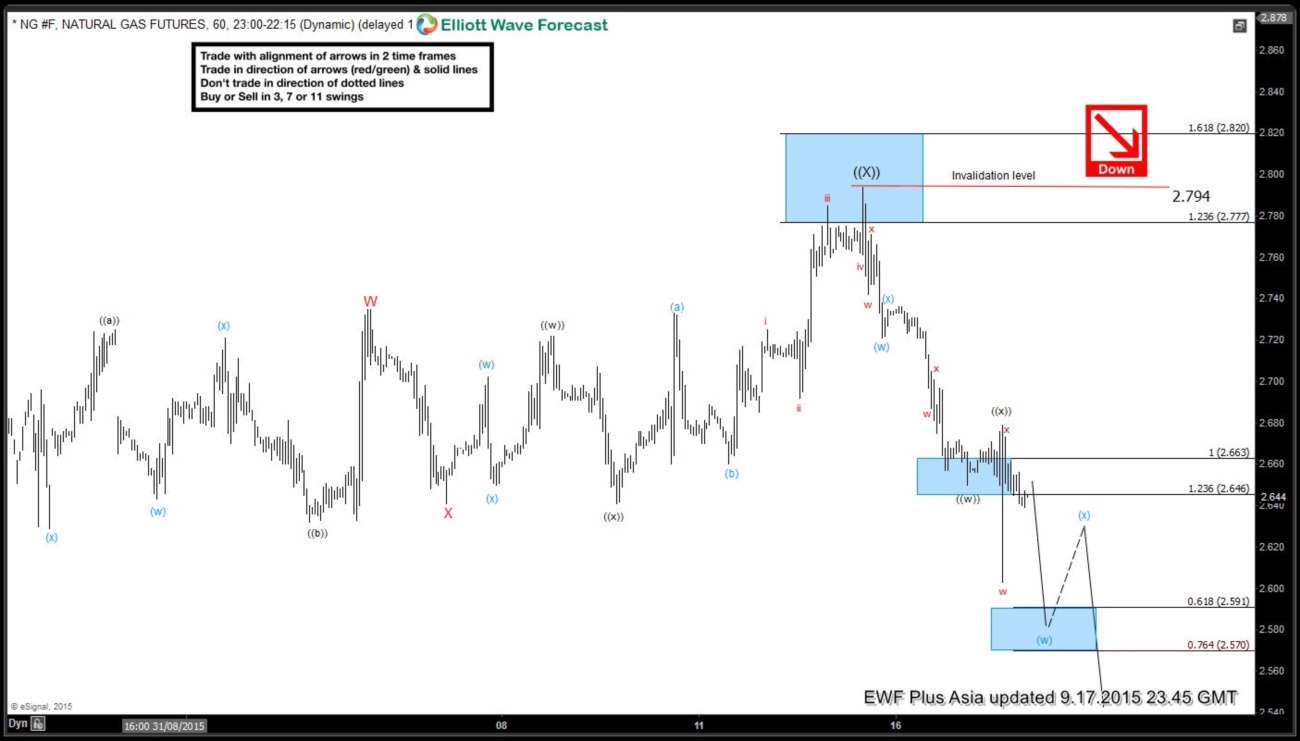
NG #F H1 Asia Update 9.17.2015
Natural Gas keeps trading lower, bounces so far have quite shallow. We are treating wave ((x)) completed and now looking at more downside in wave ((y)) toward 2.591 – 2.570 followed by more downside toward 2.535 – 2.501 area (not shown on the chart)
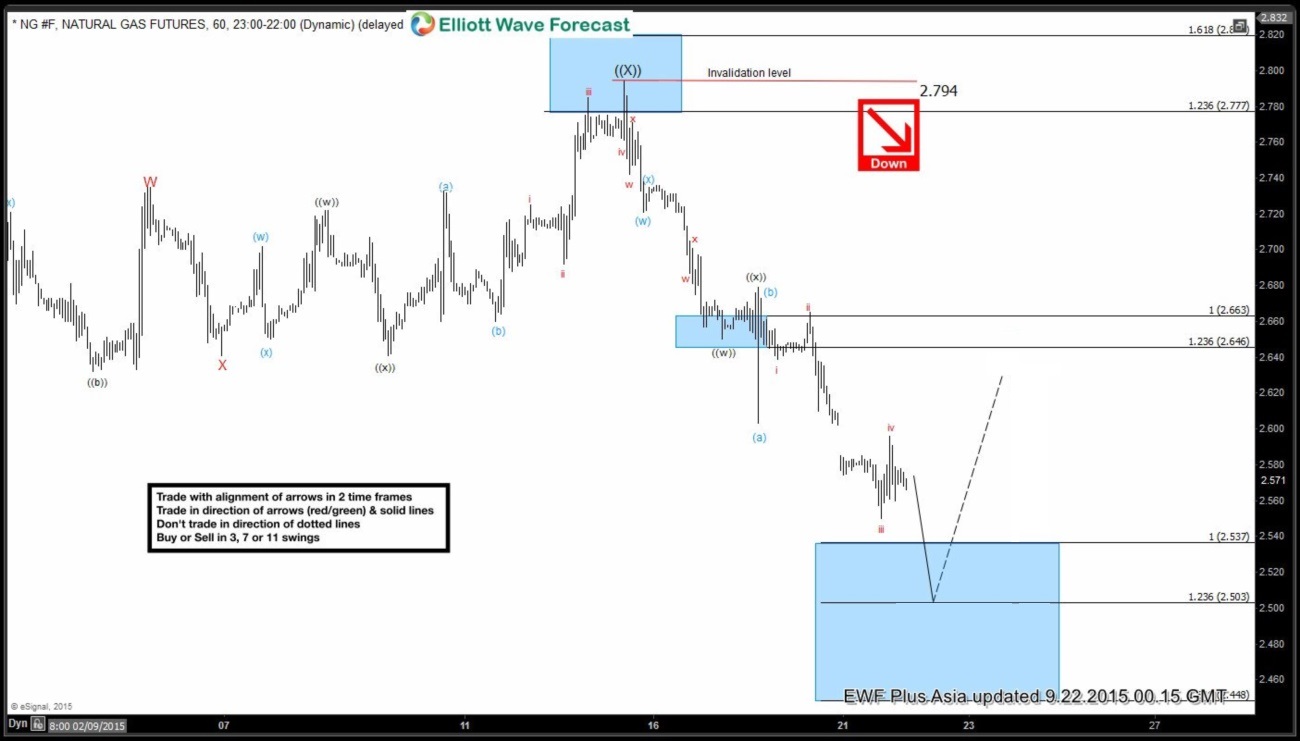
NG #F 1H Asia Update 9.22.2015
Still expecting a test of 2.537 – 2.503 region where we think a cycle from 2.794 high would end and then we would expect a 3 wave reaction higher at least in the instrument.
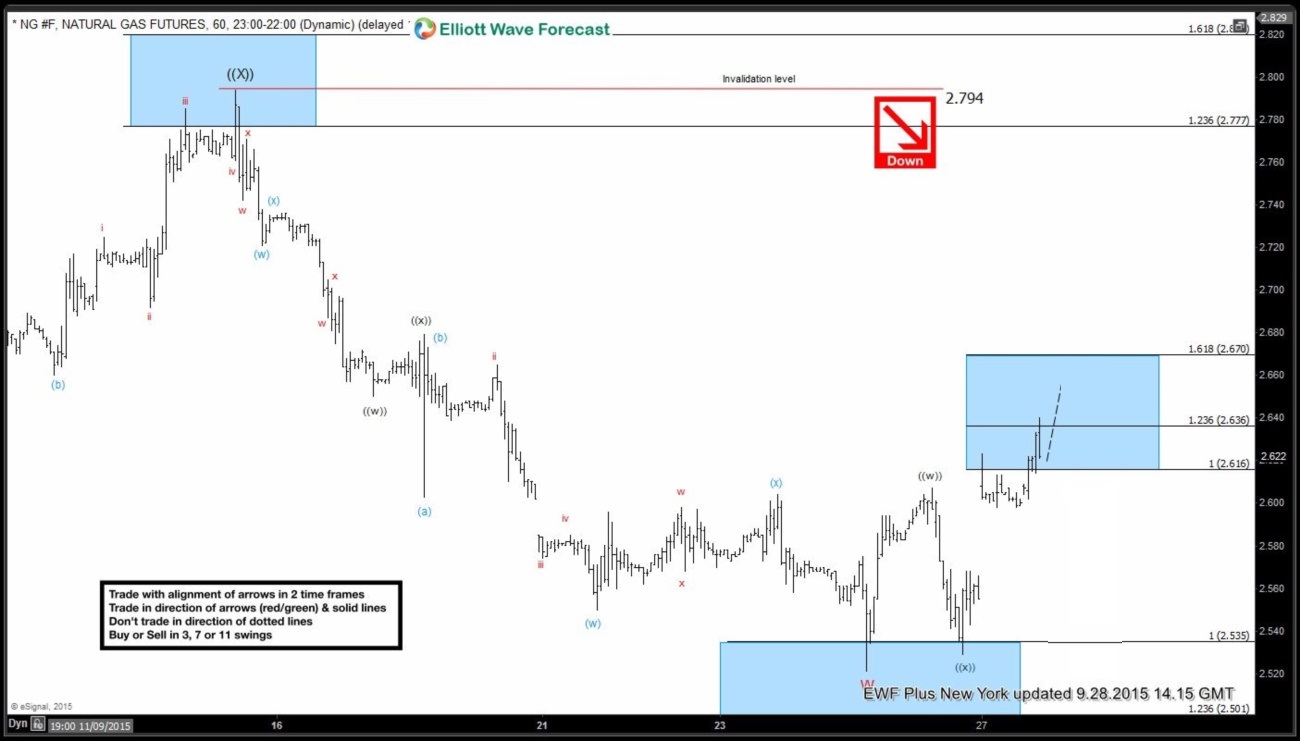
NG #F 1H NY Update 9.28.2015
And here is the reaction higher from 2.537 – 2.503 area which was a 15 minute extreme
To find out what we are expecting next in Natural Gas, click here to start your Free 14 day Trial and access Elliott Wave forecasts for 42 instruments. Proper Elliott Wave counting is crucial in order to be a successful trader. If you want to learn more on how to implement Elliott Wave Theory and learn how to trade the extremes, feel free to join us. You will get access to Professional Elliott Wave analysis in 4 different time frames, 2 live webinars by our expert analysts every day, 24 hour chat room support, market overview, daily and weekly technical videos and much more
If you are not member yet or Elliott Wave Subscribers, just sign up here to get your Free 14 days Trial
Trade Safe & Good Luck
Daud Bhatti
Elliottwave-Forecast Team
Back