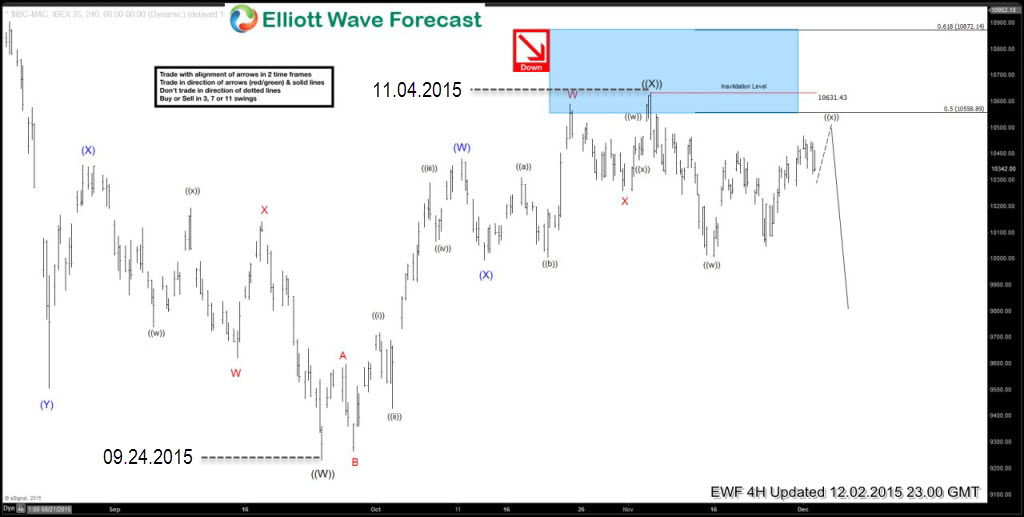
The chart below from 2 December 2015 shows the move up from 24 September 2015 low. It shows price reached and slightly exceeded the 50 % Fibonacci retracement (10588.89) level of the previous ruling cycle before getting rejected and turning lower. Initial decline was in 3 waves but broke the rising trend line (not shown on the chart) from 24 September 2015 lows suggesting Index had ended a cycle from 24 September 2015 low and rallies should fail below 10631.43 high for continuation lower.
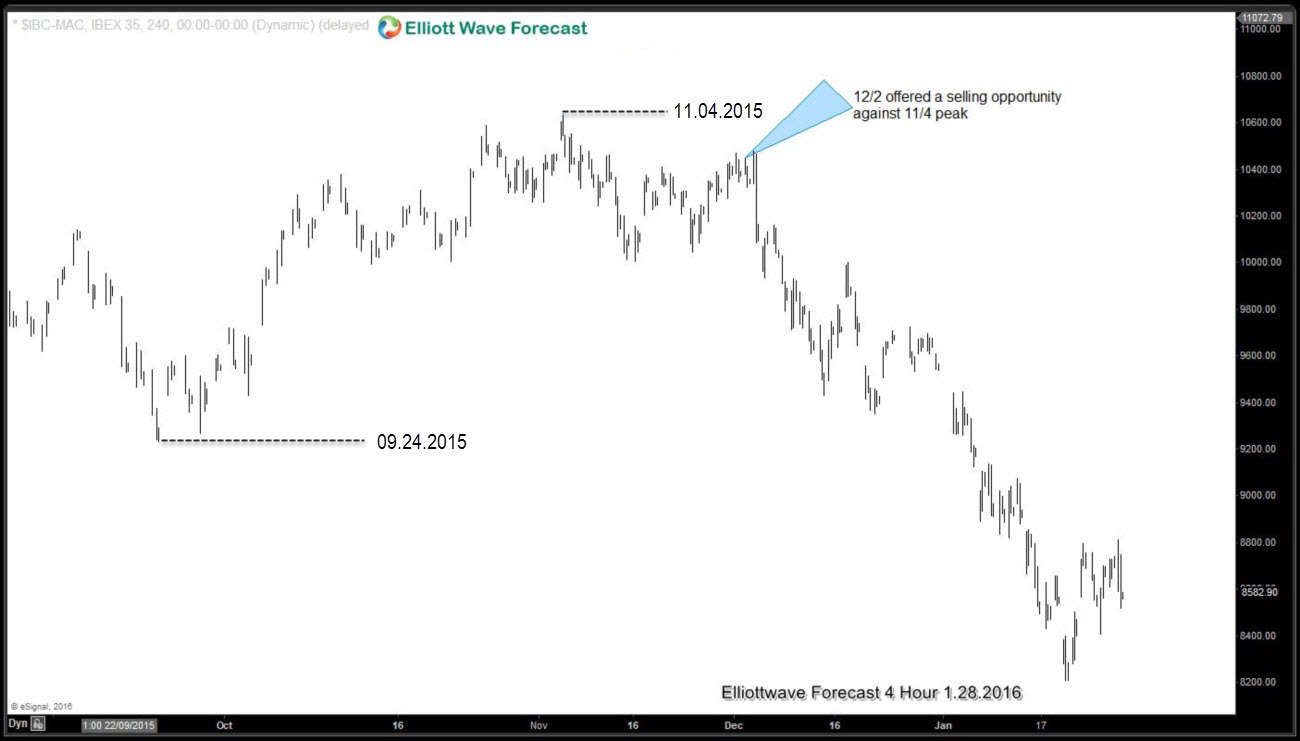
Knowing that cycle from 24 September 2015 low had ended combined with the fact that higher degree cycles were calling for a break below 24 September 2015 low provided a low risk selling opportunity in the Index when it bounced to correct the initial 3 wave decline from 10631.43 peak.
Let’s take a look at the 4 Hour chart presented to clients on 2 December 2015 calling for wave ((x)) bounce to fail below 10631.43 for next leg lower.
$IBEX nicely held below 10631.43 high and found sellers at 10441.19- 10534.57 area as expected. So far the Index made lost of 22% in the last 2 months. Current view in IBEX and other Global Indices could be found in membership area of EWF.
Proper Elliott Wave counting is crucial in order to be a successful trader. If you want to learn more on how to implement Elliott Wave Theory in your trading and to learn more about next trading opportunities in the Market, try us free for 14 days. You will get access to Professional Elliott Wave analysis in 4 different time frames, Daily Elliott Wave Setup Videos ,Live Trading Room and 2 live Analysis Session done by our Expert Analysts every day, 24 hour chat room support, market overview, weekly technical videos and much more…
If you are not member yet, use this opportunity and sign up now to get your Free 14 days Premium Plus Trial.
For any questioning, feel free to contact me through e-mail vlada@elliottwave-forecast.com or in twitter.
Welcome to Elliott Wave Forecast !
Back

