Our new clients usually need at least 2 weeks to get familiar with EWF Services and trading system before they start enjoying the profit in trading. Every day we receive questions like: “How to trade with Elliott Wave” or “Which pair is best to trade at this moment?” or “Chart of Gold is calling for a push higher, so why don’t you like buying it now?”. This blog is supposed to help you learn as quickly as possible how to interpret our charts, so you can start making low risk-high probability trades today. Click here to see Free Elliott Wave Charts
How to trade with Elliott Wave: Basic Rules
First of all, not every chart is a trading recommendation. As you may have noticed, some of the charts have Black arrows. Black arrow means the chart is not presenting high probability trade opportunity and we don’t like trading that instrument at that particular time. Elliott Wave charts with Green and Red arrows are presenting better trading opportunities. Red arrow suggests that price is in bearish trend and we should look for sell entries there. Green arrow tells us that we are in bullish trend, and we should look for buying opportunities. Before trading make sure that the chart of the next higher time frame has the same trend direction. For example, if h1 chart of $USDCAD has a Green arrow, h4 $USDCAD should also have a Green arrow.
Basic rules to trade with Elliott Wave:
-Trade with alignment of arrows in 2 time frames.
-Trade in direction of arrows (red/green) & solid lines.
-Don’t trade in direction of dotted lines.
-Buy or Sell in 3,7 or 11 swings.
Let’s take a quick look at some examples
1. To trade with Elliott Wave: Green Arrow Example
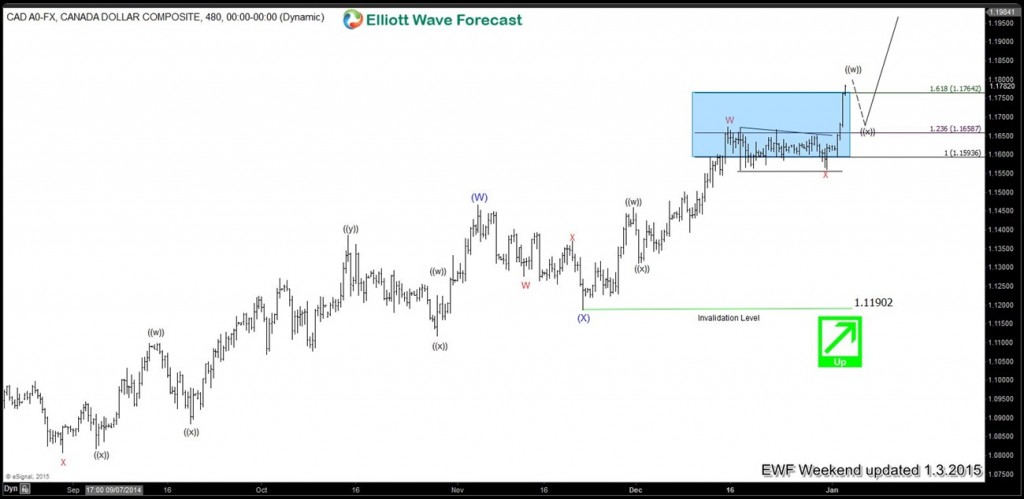
USDCAD ( H4 Weekend Update 1.3.2015.)
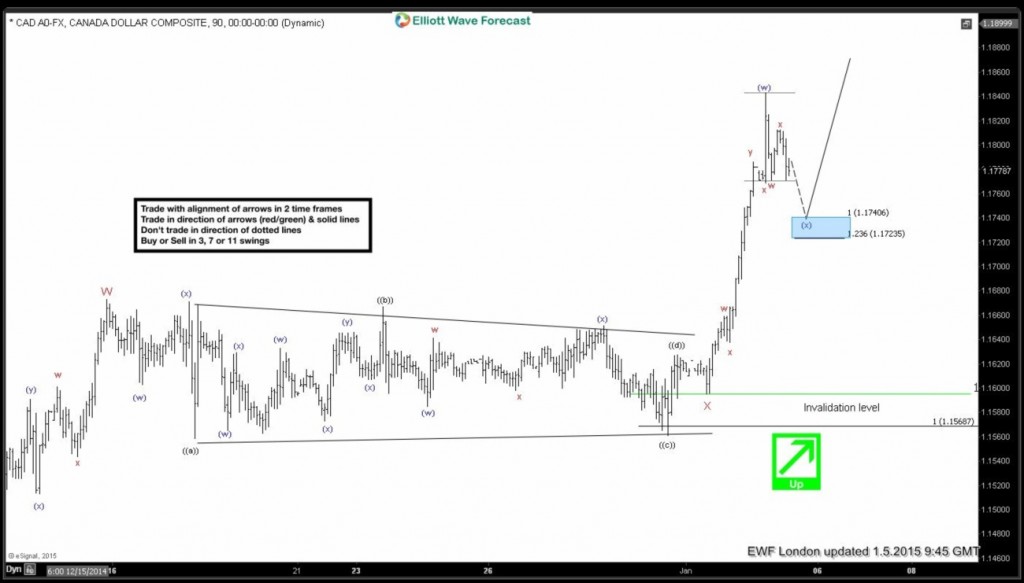
USDCAD (London Update 1.5.2015.)
The pair is doing (x) pull back which is expected to reach 1.17406-1.17235 (potential turning – buy zone) Hence, we have a green arrow on the H1 and H4 charts, trend is bullish, so we don’t like selling the pair in proposed pull back. Rather wait for mentioned area to be reached and buy the pair there.
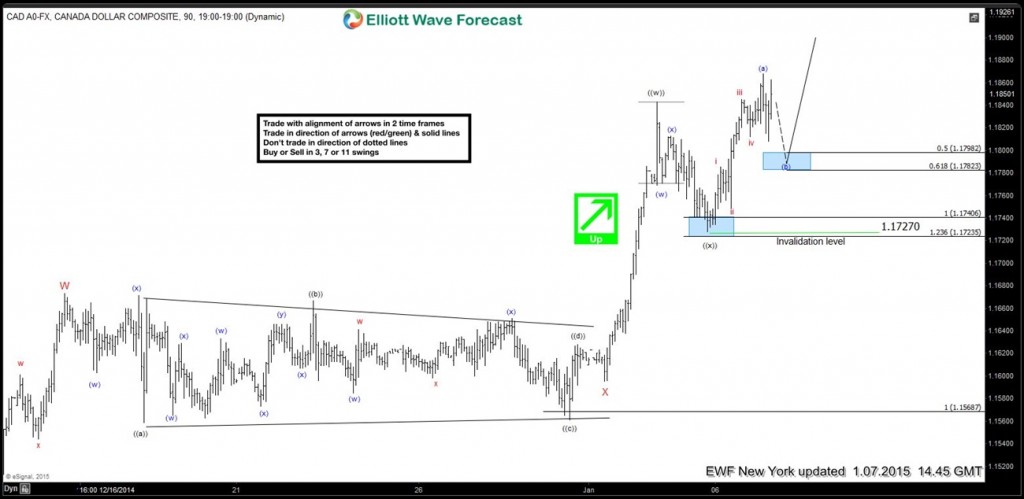
USDCAD (NY Update 1.07.2015.) Proposed area has been reached and we got rally and new short term high as expected. Currently the pair is doing pull back (b) toward 1.17982-1.17823. Green arrow is still there, which means the view is bullish, so we don’t like selling and favour long side against 1.17270 low.
USDCAD (NY Update 1.12.2015.) The pair has resumed higher as Elliott Wave chart suggested. 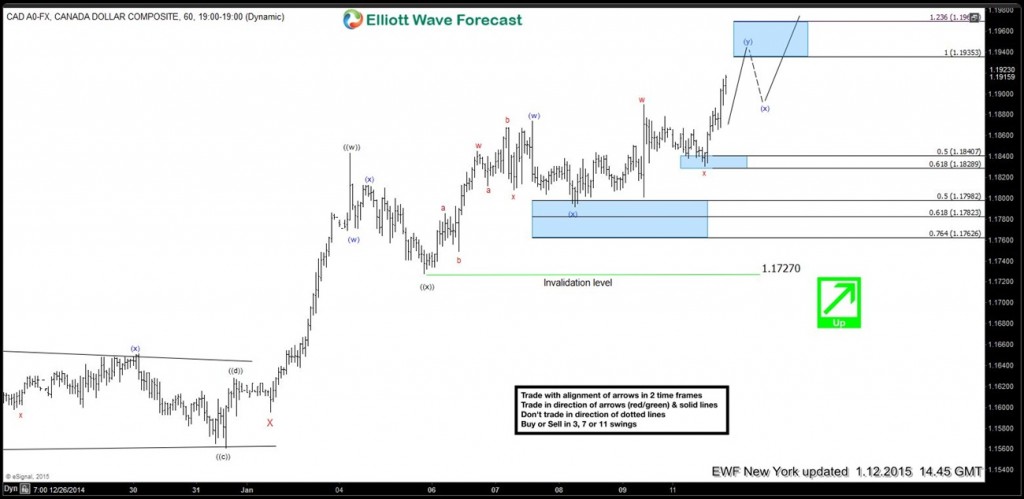
That’s how you should trade charts with Green arrows. Don’t sell the pull backs – buy the dips lower. Notice that trend direction is marked as solid line, while correction against the trend is dotted .
Remember to check that 4 hour charts also supports that view and you should have the green arrow there as well. Looking for alignment of arrows in 2 time frames is very important. For more information about Elliott Wave Trading
2. Does Elliott Wave Work: Red Arrow Example.
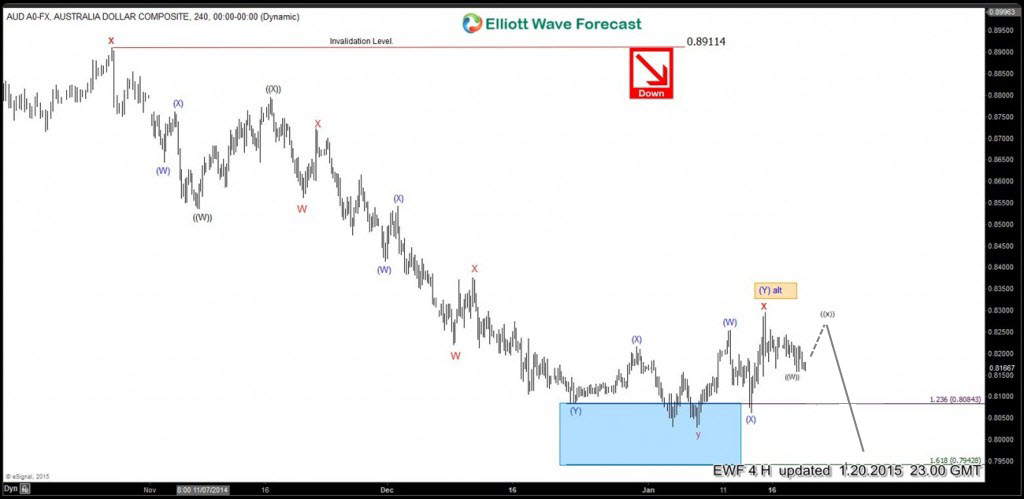
AUDUSD (H4 Update 1.20.2015.)
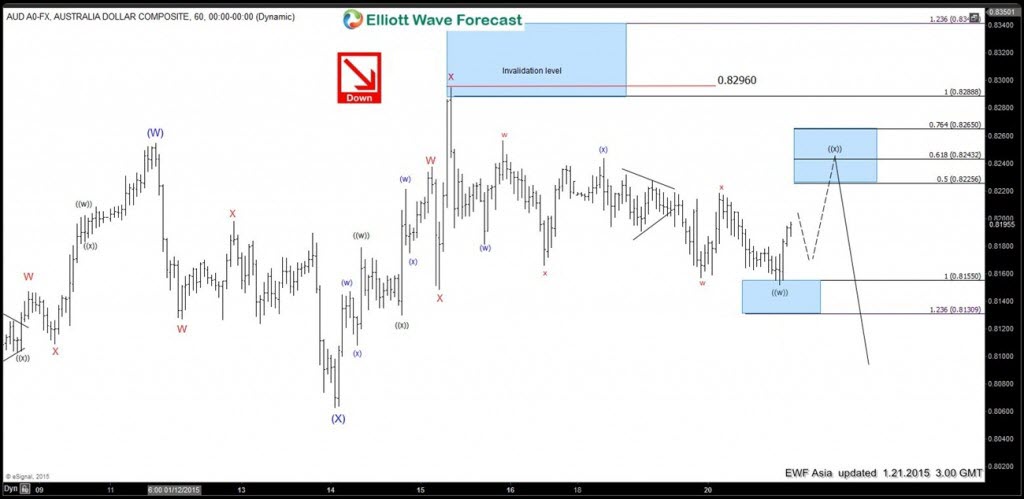
AUDUSD (Asia Update 1.21.2015.)
Now you’re a little bit more familiar with how this system works. The most of the guys who see this chart for the first time would say: “ the chart is calling for a push higher toward 0.82256-0.82432 area , let’s buy the pair now”. Unfortunately, that’s not how you should trade. So far, you already know the trend is bearish because we have alignment of red arrows in 2 time frames (H1 & H4). Also, the dotted line presents corrections against the major trend and the solid line is the direction of the trend. This chart suggests pair is doing ((x)) short term recovery, which COULD give us 0.82256-0.82432 (potential sell zone). View is bearish against 0.82960 so we don’t like buying the pair in proposed recovery, we favor selling the pair at 0.82256-0.82432, if reached.
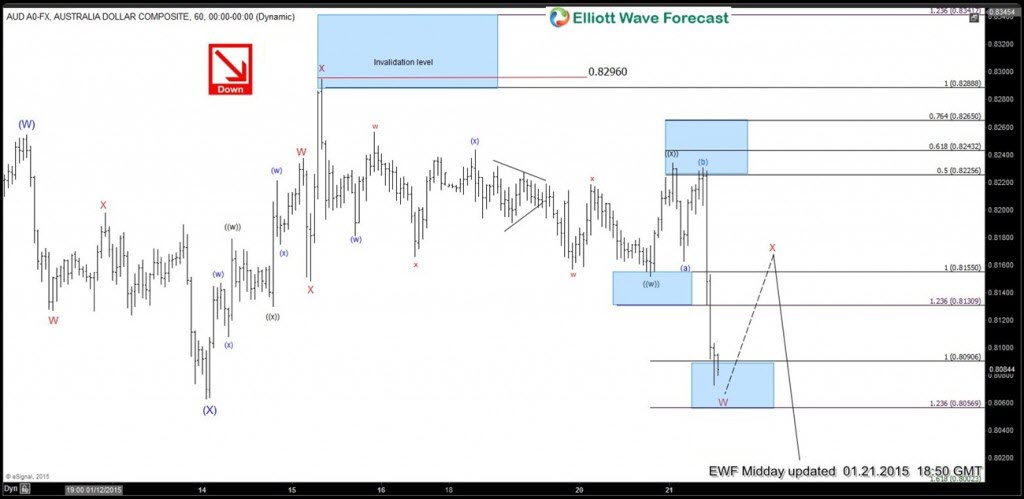
AUDUSD (Midday Update 1.21.2015.) The pair has reached 50-61.8 fib zone (0.82256-0.82432) and we got the decline as expected. Now short term bounce X could happen from 0.80906-0.80569 area. Red arrow is still there, so we won’t buy the pair, we would rather sell X bounce if it happens.
That’s how you should trade charts with Red arrows. Don’t buy the pair into short term recoveries -sell the rallies higher. Always follow the trend and make sure that H4 chart also has the Red arrow.
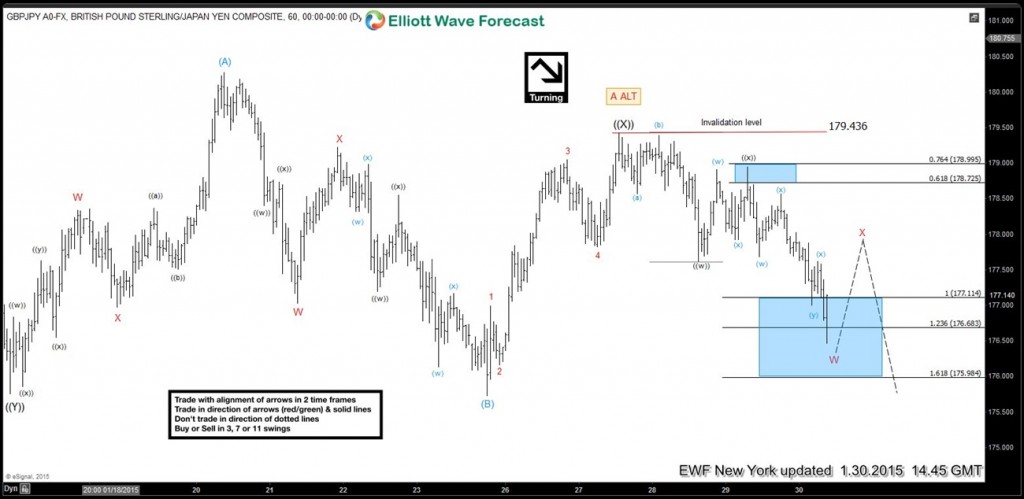
3. Trading w/ with Elliott Wave: Black Arrow Example -GBPJPY (NY Update 1.30.2015.)
This Elliott Wave count suggests the pair is in bearish trend, expected to give us short term bounce in wave x before the decline resumes again. However, we have a black arrow and alternative labeling which means this is not high probability trade, and we should rather avoid it for now…
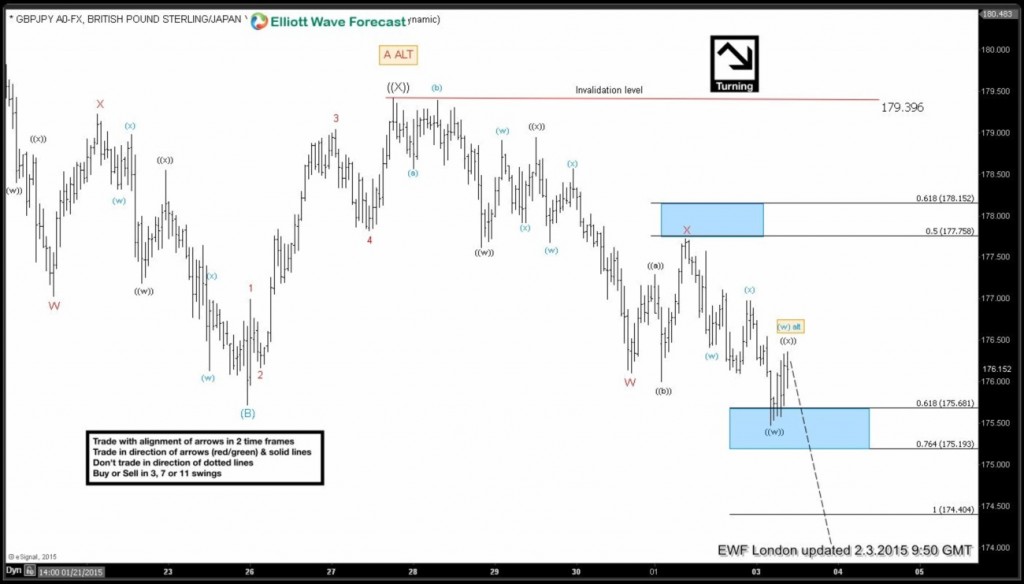
GBPJPY (London Update 2.3.2015.)
We got a short term bounce X which has reached 50 backs from the 179.396 and a turn lower as chart was suggesting. More downside is expected, however, the black arrow is still there, so it would be better to trade some other pair with alignment of arrows (Green/Red) in 2 time frames.
Reminder to Trade with Elliott Wave
-Trade with alignment of arrows in 2 time frames.
-Trade in direction of arrows (red/green) & solid lines.
-Don’t trade in direction of dotted lines.
-Buy or Sell in 3,7 or 11 swings.
If you would like to have an access of EWF analysis in real time, feel free to join us. Now you have an opportunity to sign up for 14 Days Trial and get a Full access of Premium Plus Plan in 2 weeks. We provide Elliott Wave charts in 4 different time frames, 2 live webinars by our expert analysts every day, 24 hour chat room support, market overview, daily and weekly technical videos and much more.
If you are not member yet, just sign up here to get your 14 days Premium Plus Trial.
Back
