I was thinking today about how I really started taking this blog increasingly social jargon, investor’s education, competitions, contests values , and the like. And among all this remarkable, entertaining, educational, intellectual and I forgot to mention an important fact that every trader knows or should know information. The fact is that any rational analysis on the market will flow back to one of two ways: Either Fundamental or Technical view. Just read the letters and look at the volumes, trends and lines of support or resistance? Well, then you are very focused on technical analysis! Do you base your investment decisions in the last three years of profit growth, taking into account debt, supply and demand, seasonal cycles and government policy? Well, then you are very focused on fundamental analysis!
Here are some major differences between them:
Fundamental analysis will focus on the economy, usually macroeconomics to help determine the natural value. What this means, “Hey, interest rates may be affected later this year, which will surely affect this or that”. Technical analysis, on the other hand does not care what the economy is doing. 10 % Gap ups are more important than interest rate hikes or insubstantial news event.
Fundamental analysis focuses on financial ratios and numbers such as debts, EPS, cash flow forecasts, dividend payout ratio, price to earnings ratio, dividend yield etc in terms of Stocks and moreover interest rates, employment, economic growth. Whereas technical analysis focuses on historical price movements to determine possible short term or long term moves to come.
Technical trading provides a level in example “an area in which you can enter the Market and also provides a level as a target and an invalidation level (where the idea is considered wrong) “on the other hand Fundamental trading doesn’t provide “entry or exit” in the market (which makes it complicated & most of the time end up losing).
Combination of both? Traders usually try to combine both and then usually spend time looking at charts and all the study and analysis goes away when they start looking at the news or Fundamental part of trading.
How do we see it??
Overall, nothing can be predicted 100 % market share but at least the technical operator can reach the edge and anticipate the market and be able to know the levels / areas which if exceeded would negate the view. In Elliottwave-Forecast, we follow the technical factors , as everyone knows that Elliott wave theory is suggestive and will provide many scenarios. For years, we have understood that nature and have created a distribution system and other tools to take away subjective nature of the theory and understand the nature of what we call the right side of the market. This combined with sequence of swings, market correlation, money management and picking operations with the risk / reward, so that it would be profitable even if one won only 4 out of 10 operations, will provide the advantage of becoming a successful trader / investor. We believe in relationships, Mathematics, and the understanding that no human can predict the market 100 % correct and only in this way , you can stay profitable over a period of time i.e. at the end of a quarter / year.
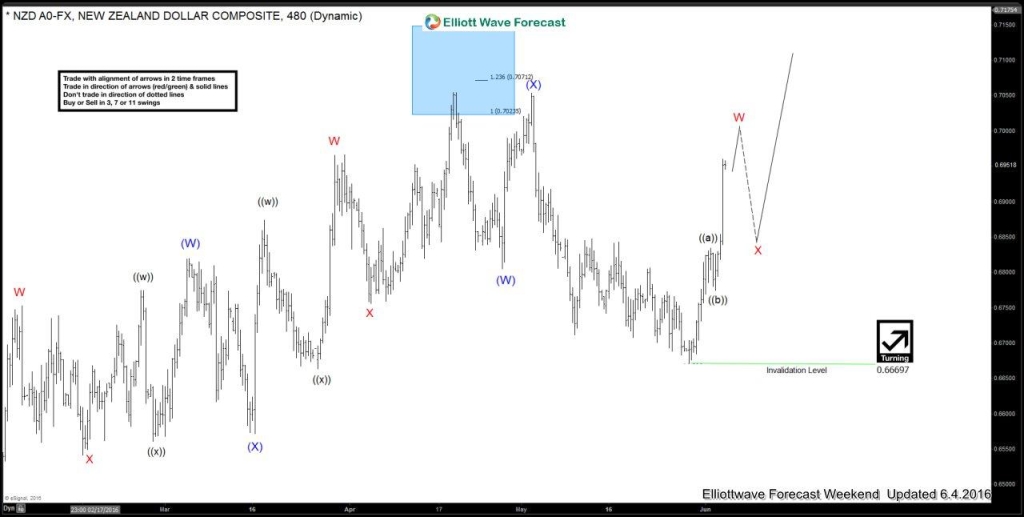
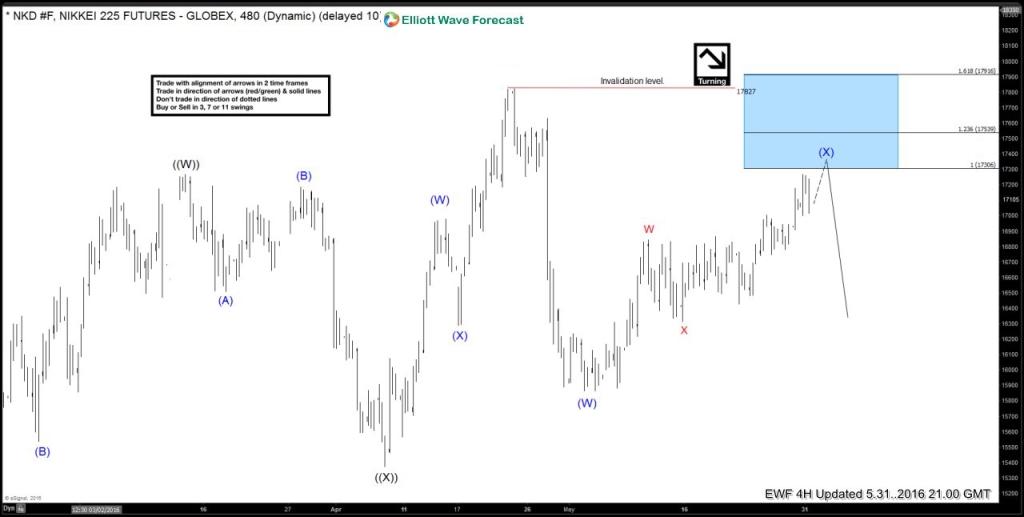
Let’s see a couple of examples:
NZDUSD June 4 Weekend updated chart:
Nikkei May 31 4 Hour updated chart:
We rely on Elliott wave structures, sequence of swings, market correlation and market distribution to analyse and trade the markets. If you want to learn more on how to implement Elliott Wave Theory in your trading and to learn more about next trading opportunities in the Market, try us free for 14 days. You will get access to Professional Elliott Wave analysis in 4 different time frames, Daily Elliott Wave Setup Videos ,Live Trading Room and 2 live Analysis Session done by our Expert Analysts every day, 24 hour chat room support, market overview, weekly technical videos and much more. If you are not member yet, use this opportunity and sign up now Free* for 14 days.
Back


