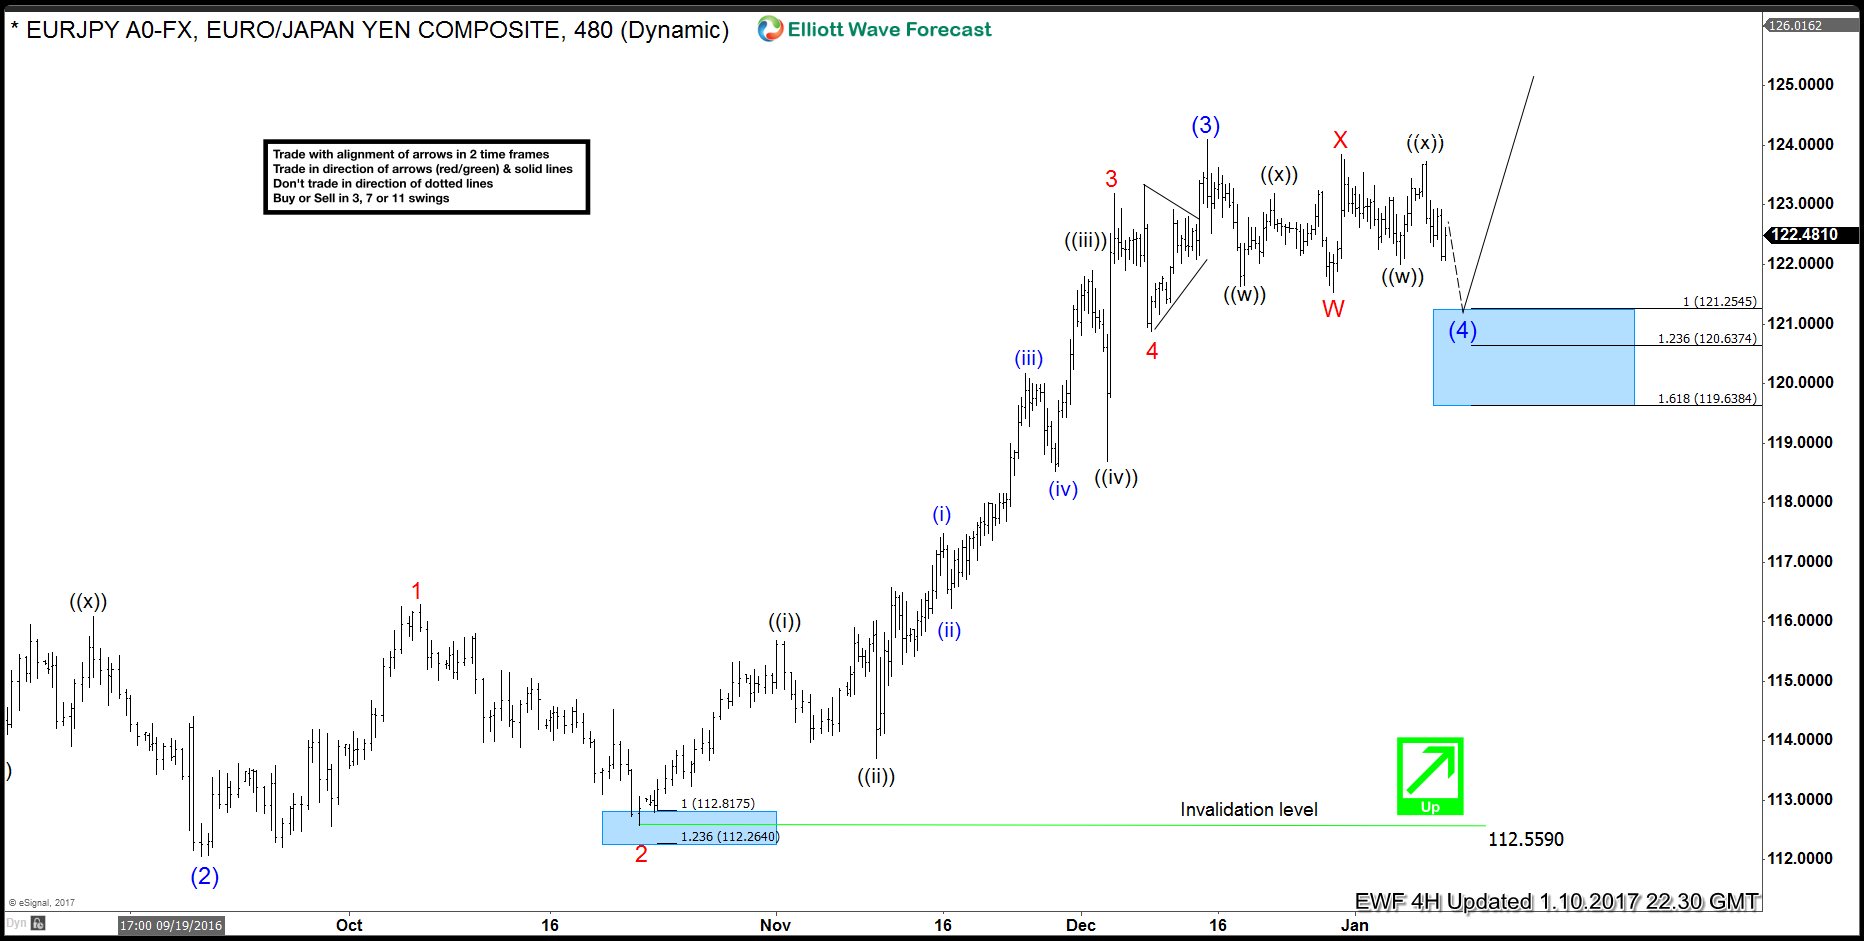
EURJPY has been in a sideways consolidation for the last few weeks and today it broke lower from the consolidation. Many might view it as start of a sustained decline but looking at the choppy nature of the decline from blue (3) peak, we are viewing it as a wave (4) blue pull back of an incomplete 5 wave Elliott wave cycle up from 6/24/2016 low. Wave (4) could unfold as a simple 3 wave pull back, double three, triple three, zig-zag, FLAT or a triangle. In this wave count, wave (4) has taken the form of a double three, WXY structure and expected to complete in the highlighted blue box area between 121.25 – 120.63 and in extension 119.63. Once wave (4) blue is complete, expect the pair to turn up and make a new high in wave (5). Minimum target for wave (5) would be inverse 1.236 Fibonacci extension of wave (4). Assuming wave (4) completes at 121.25, then the minimum target for wave (5) would be 124.81. If inverse 1.236 Fibonacci extension of wave (4) dip is exceeded, then we would look at one of the other two methods described here.
EURJPY 8 Hour chart
Another possibility is that the highlighted blue box area (121.25 – 119.63) would only complete first leg of wave (4) pull back i.e. wave W and result in a 3 wave bounce to correct the decline from (3) peak and then make another 3 wave extension lower to complete a larger WXY structure in wave (4). We don’t like selling the pair and expect buyers to appear in 121.25 – 119.63 area for new highs or a 3 wave bounce at least. Even if the pair doesn’t make a new high, expected minimum 3 wave bounce from above mentioned area would allow the buyers to get into a risk free position.
In order to access full Elliott Wave Analysis of EURJPY all time frames and also get access to other Yen pairs, US Dollar pairs, Commodities and Indexes, try EWF Free for 14 days.
Back

