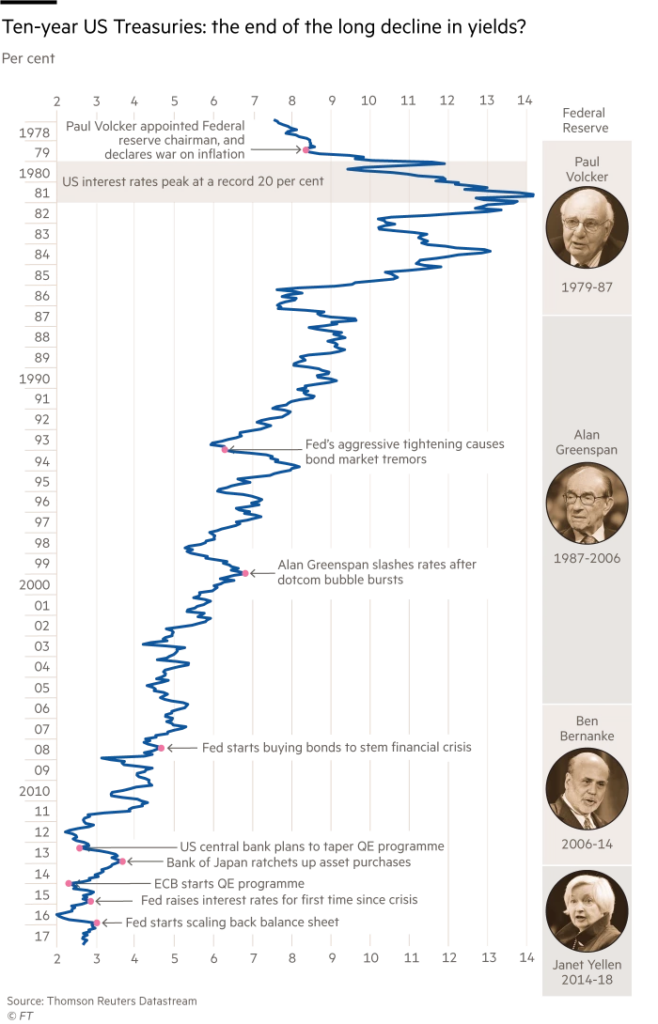
The bond market has enjoyed a strong bull market for nearly four decades with yields continuing to go lower. The bull market has been going on for so long that no current active fund manager can imagine what it looks like when interest rates were to be like the 1980s at 20%. If people in the 1980s started trading in their early thirties, they would have been almost 70 years old by now, so chances are they are not active in the market anymore.
The dot com bubble and 2008 financial crisis continue to turbocharge the great bond bull rally with central banks cutting interest rates around the world and multitrillion-dollar-bond-buying programmes. However, the period of easy money could be ending this year. The Fed, ECB, Bank of Japan have all started to taper their bond purchase program. The Fed is the first one to stop the bond buying program and it’s also the first to embark in balance sheet normalization, or QT (Quantitative Tightening). As Central Banks have been big buyers of bonds for the past decade, questions arise as to whether this shift to tapering would finally prompt the great bull market to end.
The markets have enjoyed monetary support from global central banks for the past 10 years. When the Federal Reserve stopped its quantitative easing programme in 2014, the Bank of Japan took the baton with an even bigger scheme. When the Fed started raising rates in 2015, the European Central Bank (ECB) started a new quantitative easing programme. Last year, Central Banks bought $1.5 trillion of bonds.
But this year investors for the first time in a decade, central banks can be withdrawing money from the market. The Fed has started to slowly shrink its balance sheet last year. This month, the ECB’s bond buying reduced by half to €30 billion a month and the programme would likely end this year. Bank of Japan’s purchase of long-dated bonds had also slowed.
Indeed the bond market has started to decline and as a result the yields have been going up as the charts below show:
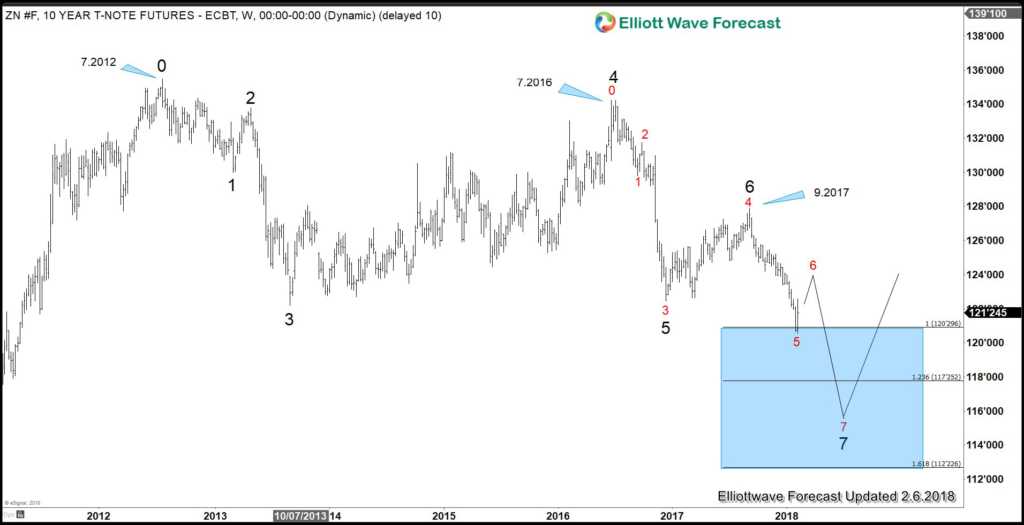
Weekly Chart of 10 Year Notes (ZN_F)
Ten Year Note (ZN_F) shows a bearish sequence from 7.2012 high (135.15) as well as from 7.2016 high (131.35). The instrument shows 7 swing sequence (in black color) from 7.2012 high and the minimum 100% target at 120.3 has been reached. However, there is another sequence (red color) starting from 7.2016 high and this sequence only shows 5 swing, thus another leg lower is expected to end 7 swing from 7.2016 high and also 7 swing from 7.2012 high.
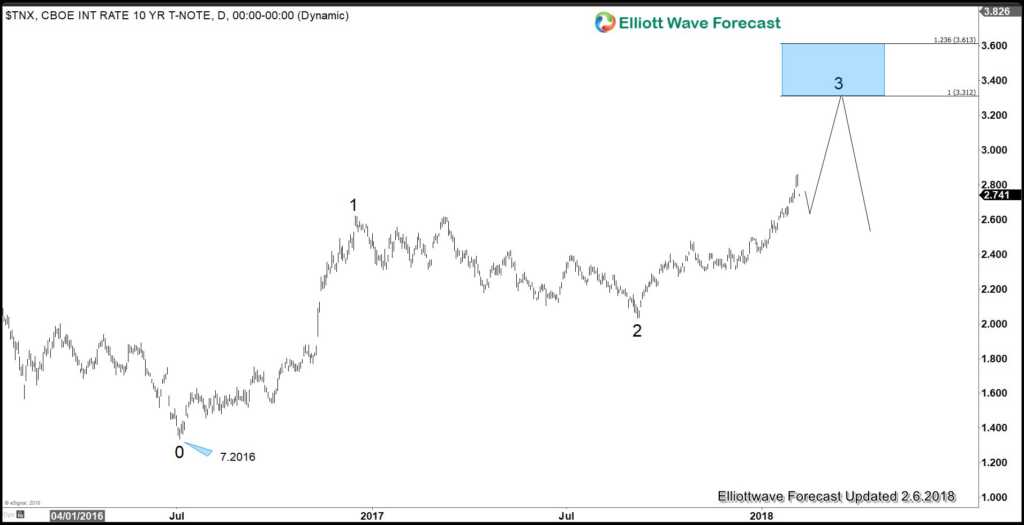
TNX (10 Year Yields) Daily Chart
10 Year Yields (TNX) is the inverse of ZN_F (10 Year Notes) and the yield shows 3 swing bullish sequence (higher high) from 7.2016 low. 10 year yields potentially can target 3.31 – 3.61% this year to end the third swing. Thus the charts above suggest that 10 Year Notes will continue to sell and 10 year yields will continue to rise this year.
But the bigger question is whether the 38 year bull market in the bonds has ended. We will look at the two long term charts of TNX below: One using linear scale and another one using logarithmic scale
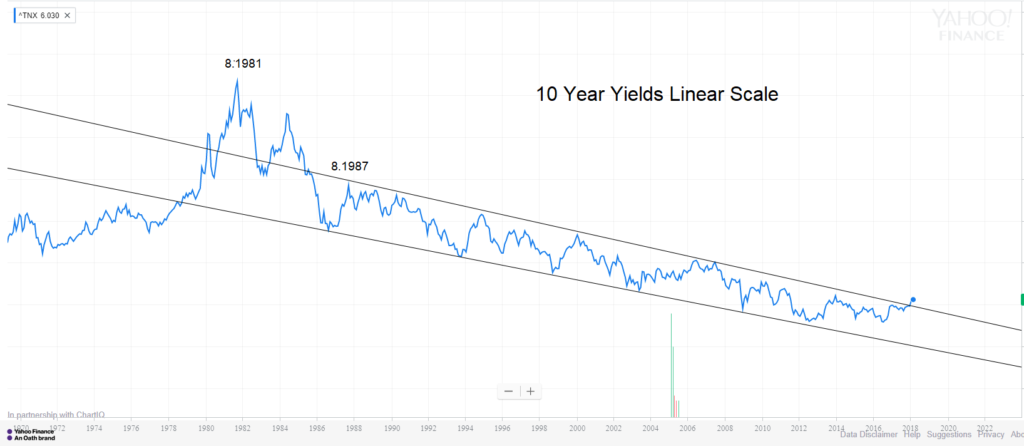
Long Term Charts of 10 Year Yields (TNX) Linear Scale
Looking at the long term charts of 10 year Yields since the 8.1981 high (15.84)%, we can see that the yields have broken above the parallel channel drawn from 8.1987 high. At first glance, this suggests the possibility that the yields may have ended cycle from 8.1987 high and possibly from 8.1981 high as well. However, since we are looking at very long term chart, it’s useful to also look at it using logarithmic scale, which is usually more accurate for a long term chart
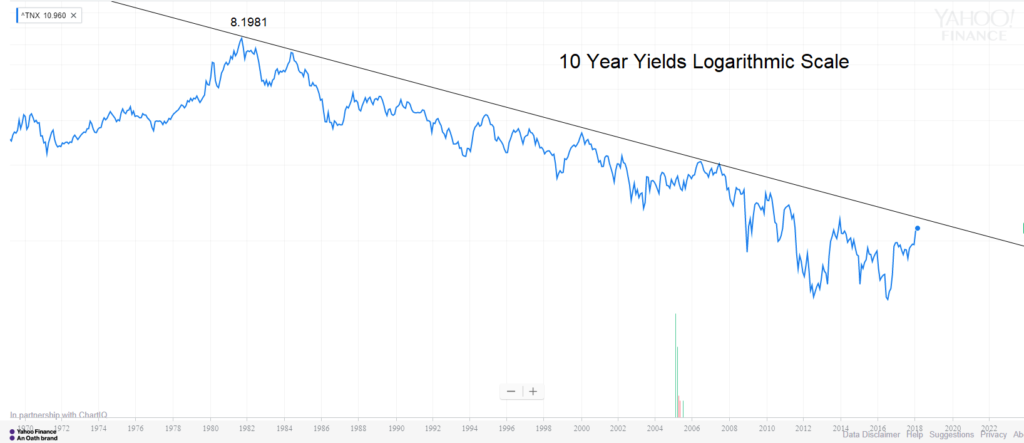
Long Term Charts of 10 Year Yields (TNX) Logarithmic Scale
Looking at 10 year yields with logarithmic scale, we can draw a trend line from 8.1981 high and so far the yields have not broken and closed above it which comes around 3.05 – 3.10% and descending by 0.05% every month approximately.
Since usually logarithmic scale is more relevant in long term charts, the 10 year yields need to break and close above 3.1% with conviction before the 38 year bull market in the bond could be considered ending.
If you enjoy this article, check our work and join Free 14 days Trial to see Elliott Wave Forecast in 78 instrument, as well as getting access to Live Trading Room, Live Session, and more
Back