Lately we were doing a lot of educational blogs, explaining various Elliott Wave Patterns through real Market examples. Now we invite you to take this short Quiz in order to test your Elliott Wave knowledge.
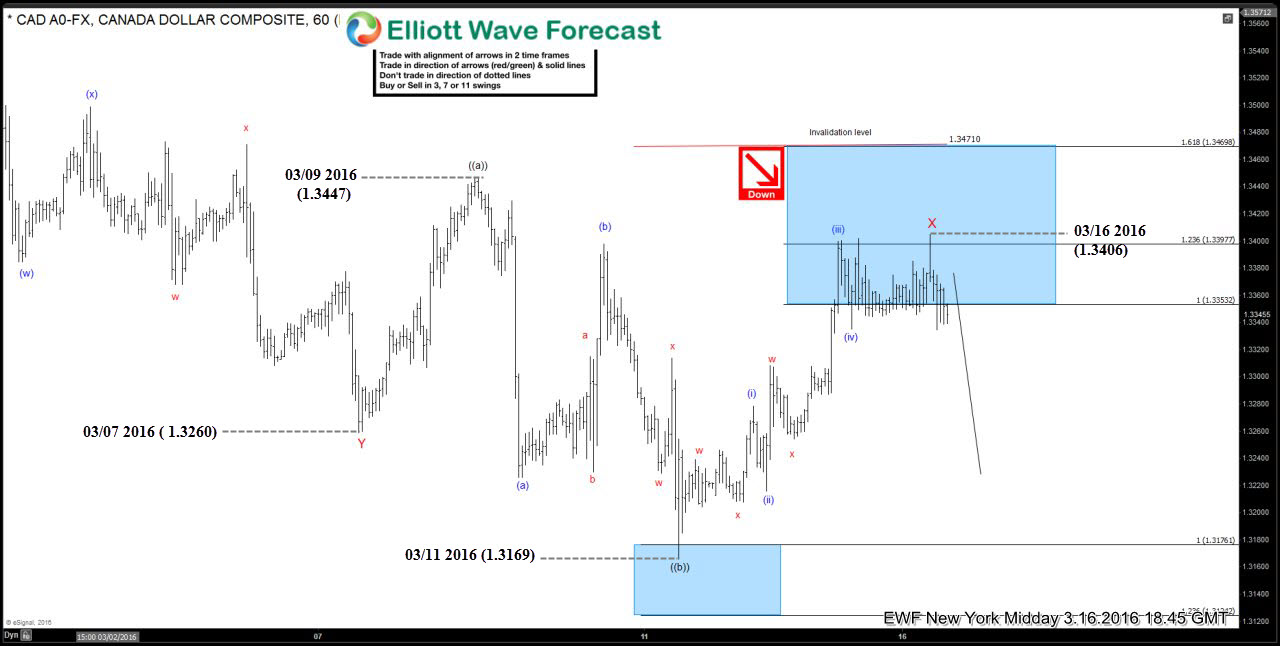
$USDCAD chart below shows our forecast from 16. March 2016 .It’s calling x red connector completed at 1.3347 and suggesting further extension of the downtrend while the price stays below that high and more importantly while below 1.3471 level.
Take a close look at the chart and check if you know the answers to these three questions:
1. Considering wave x red connector started at the 03/07 2016 (1.3260)low and ended at 03/16 2016 (1.3406) high, what Elliott Wave Pattern is it ?
a) Expanded Flat
b) Running Flat
c) Triangle
d) Ending Diagonal
2. Rally from the 03/11 2016 (1.3169) low up to 03/16 2016 (1.3406) high unfolds as what structure ?
a) Zig-Zag
b) Double Three
c) Triple Three
d) Ending Diagonal
3. What’s the inner labeling of mentioned x red connector ?
a) Black ((a)) ,((b)),((c))
b) Blue (a),(b),(c)
c) Blue (i),(ii),(iii),(iv),(v)
d) Red w,x,y
90% of traders fail because they don’t understand market patterns. Are you in the top 10%? Test yourself with this more advanced Elliott Wave Test
Send us the answers to vlada@elliottwave-forecast.com and win 30% Discount on any Subscription Plan you choose. These discounts will be applied only to new members. Existing members who take the quiz, will get opportunity to choose one Educational Seminars with 50% discount. Keep in mind Discounts are limited.
If you’re not able to answer to these questions, you have opportunity to get 14 days of EWF membership for Free and learn from our Market Experts.
In Free Trial you get access to Professional Elliott Wave analysis of 50 instruments in 4 different time frames, Daily Elliott Wave setup videos, 3 live webinars by our expert analysts every day, live trading room, 24 hour chat room support, market overview, daily and weekly technical videos and much more…
Welcome to Elliott Wave Forecast !
Back
