We all think we know the story of “Humpty Dumpty”. We all have heard the tale of the Wall and his Great Fall. We know how hard the soldier tried but couldn’t get Mr. Dumpty back together again.
Similarly keeping that story on mind on previous Thursday April 28th, when Bank of Japan showed up in there monetary policy meeting, in which they didn’t keep up with the market expectations of further easing or any substantial tool to weaken the ongoing strength in Yen since early this year. However in there policy meeting, they maintained the negative deposit rate to 0.1 percent & it’s 80 trillion Yen base money target on hold, sending Yen soaring 2% against the US Dollar and NIKKEI tumbling 3.6% the same day.
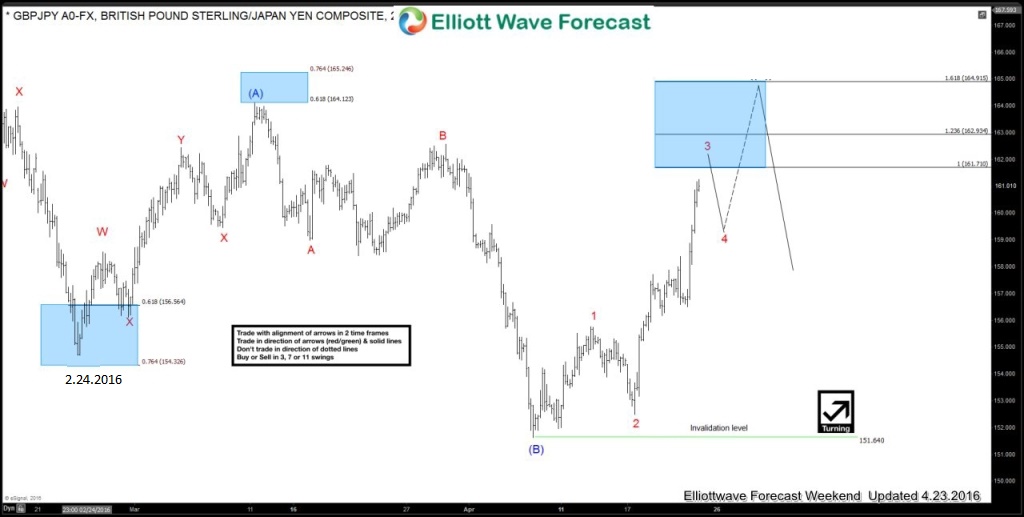
We believe Somehow Technical analysis runs ahead of fundamental, especially when Market is giving you an edge. Now the question is how we anticipated the BOJ move? Let’s take a look at the chart of GBPJPY below:
Chart of 4.23.2016 is showing a Flat pattern from 2.24.2016 lows (154.70) low, where wave (A) in blue unfolded as triple three structure & wave (B) lower as Zigzag structure, up from there pair was showing 3 swings with 4 & 5 in wave (C) recovery yet to complete the FLAT (3-3-5) structure and then resume the decline for new lows below 151.64 or make a larger 3 wave pull back at least to correct the 5 swing move from 151.64 low. This is how we knew GBPJPY was close to a drop and we were ready for it.
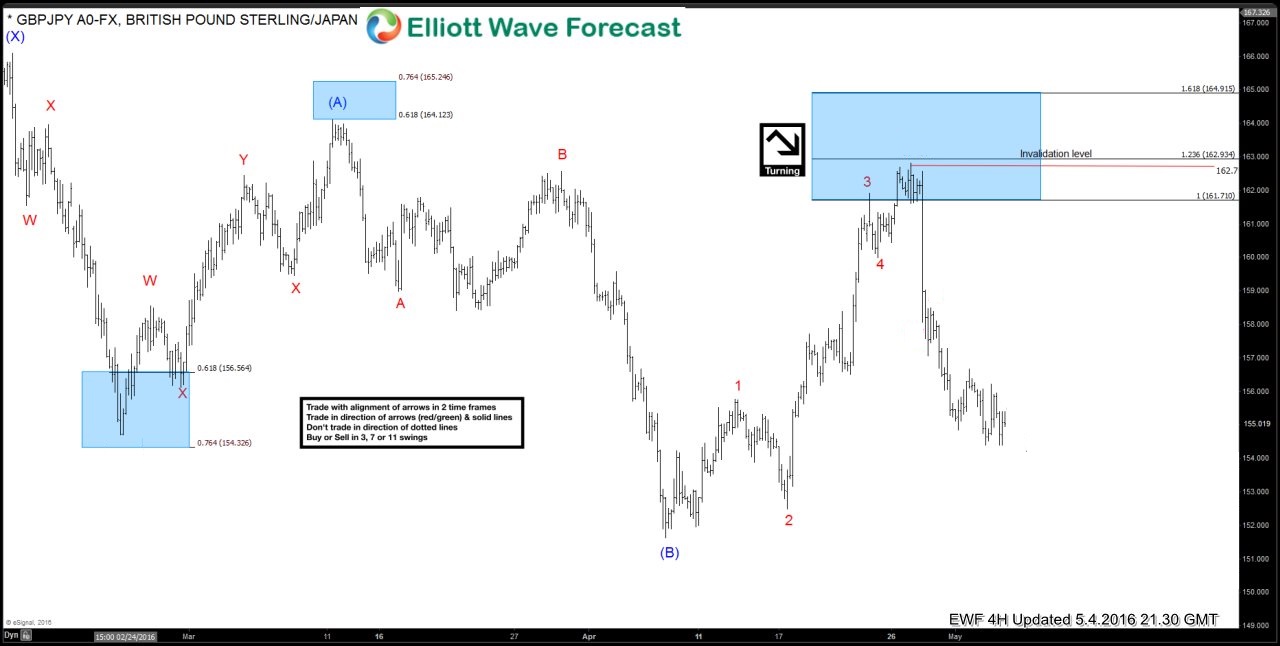
This is what happened after pair completed 5 swings in wave (C) and the proposed FLAT within the blue box.
If you would like to learn more about Elliott Wave Theory, the way we use it for analysis and trading and get Elliott wave forecasts for 50 markets in 4 time frames, you can sign up for Free 14 day Trial of our services.
Back

