Zig-Zag is the most famous corrective pattern in Elliott Wave Theory, but in reality we don’t see it very often. These days we could see very nice zig zag pattern that forming in DAX h1 chart. Before we take a look at real example we will explain the Elliott Wave pattern first.
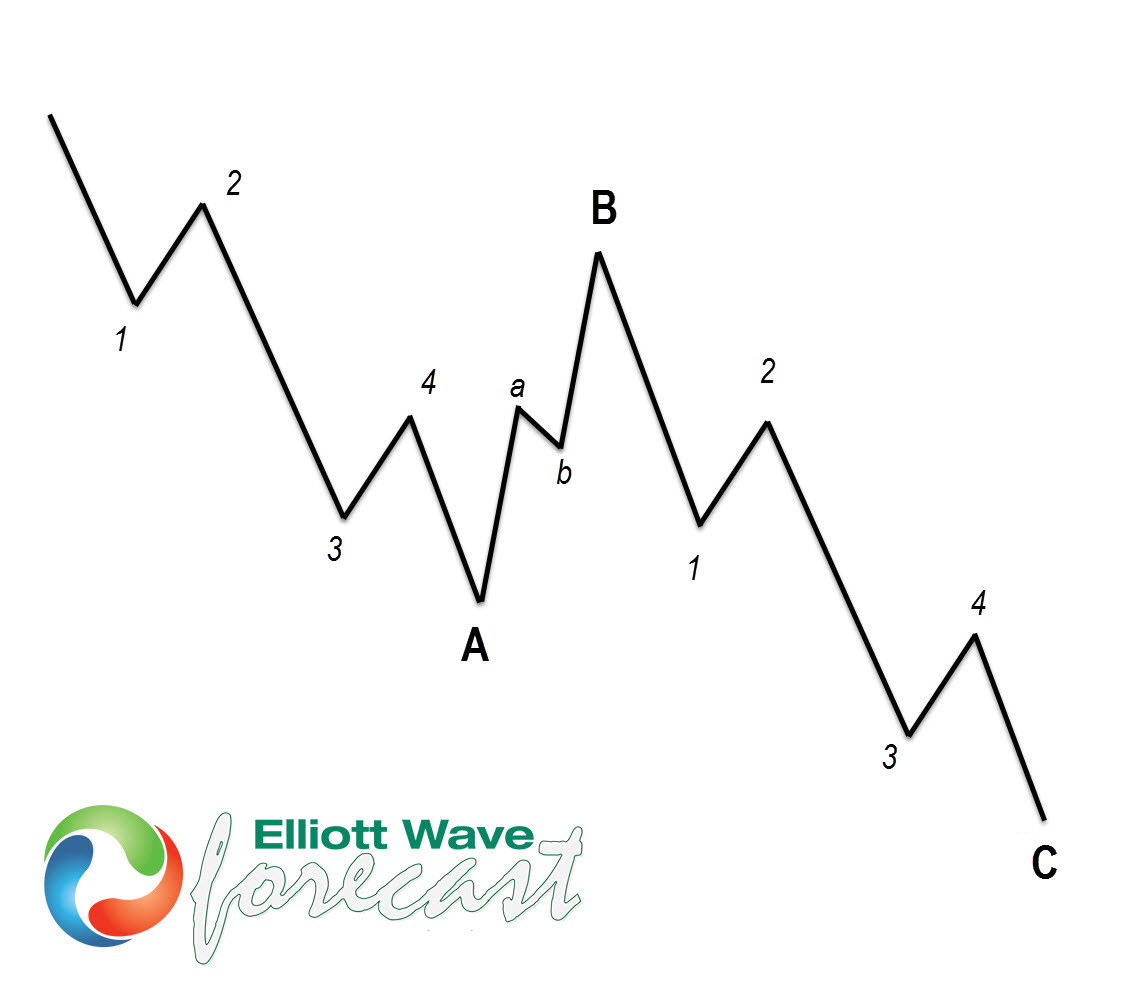
Zig zag iz 3 wave corrective Elliott Wave pattern that contains 5-3-5 inner structure. It’s labeled as A,B,C where A =5 waves, B=3 waves and C=5 waves. That means A and C are impulsive or diagonal patterns and they must meet all conditions of being 5 wave structures such as: having RSI divergency between wave subdivisions, ideal Fibonacci extensions, retracements and so on…
On the picture below we see what bearish Elliott Wave Zig Zag pattern looks like: clear 3 wave ABC form, with 5,3,5 inner structure…

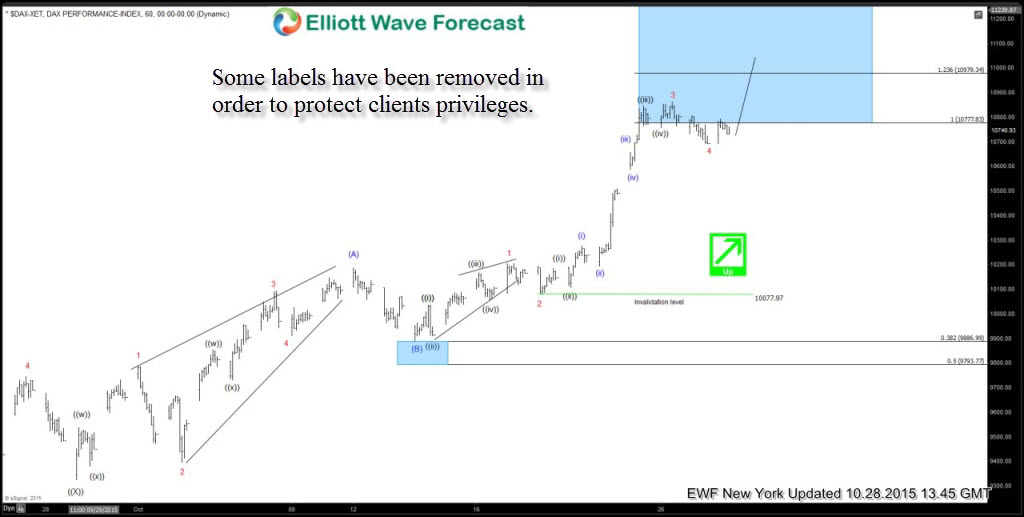
Now let’s take a look at real market example of $DAX
$DAX 10.282.2015 NY Update: Zig Zag Pattern is in forming, currently we’re in wave 5 red of (C) blue which is expected to give us more strength to complete the pattern. Potential target areas come at inverse 1.236-1.618 FE of red 4 at 10904-10972 and 0.618 ext of waves 1 + 3 at 11647.1. We could see wave (A) ended at 10114.7 as leading diagonal structure. Wave (B) pull back completed right at 38.2 fib retracement level at 9886.9 and from there the price is forming clear impulsive 5 wave structure, where each of 5 waves contains 5 waves subdivision. Wave 4 red is done at 10695.2 and while the price holds above that level, we should ideally see another 5 wave rally toward 9886.9+ area to complete zig zag pattern.
Note: Further path has been removed in order to protect EWF’s clients privileges.
If you are not member yet or Elliott Wave Subscribers, just sign up here to get your Free 14 days Premium Plus Trial so you could access to professional Elliott Wave analysis and trading recommendations in real time.
Welcome to Elliott Wave Forecast !
Back

