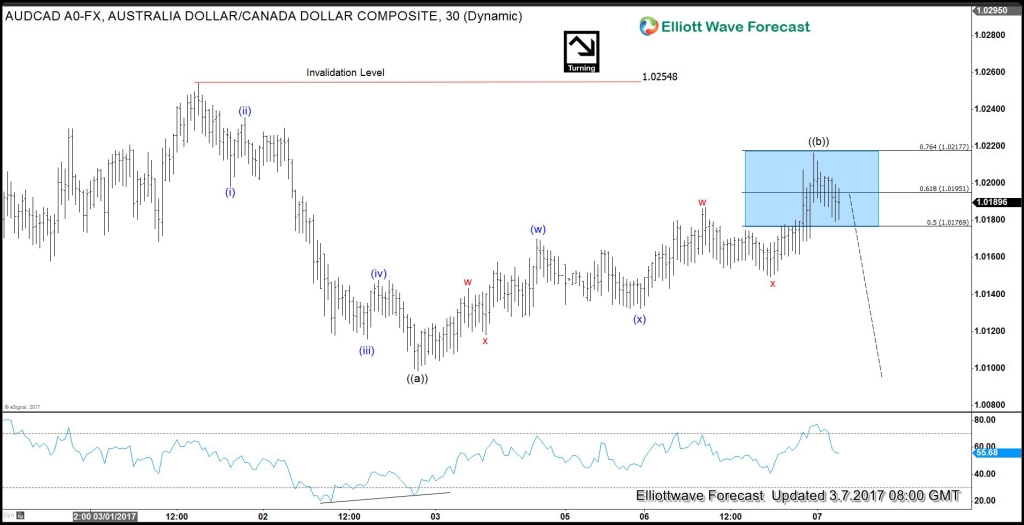
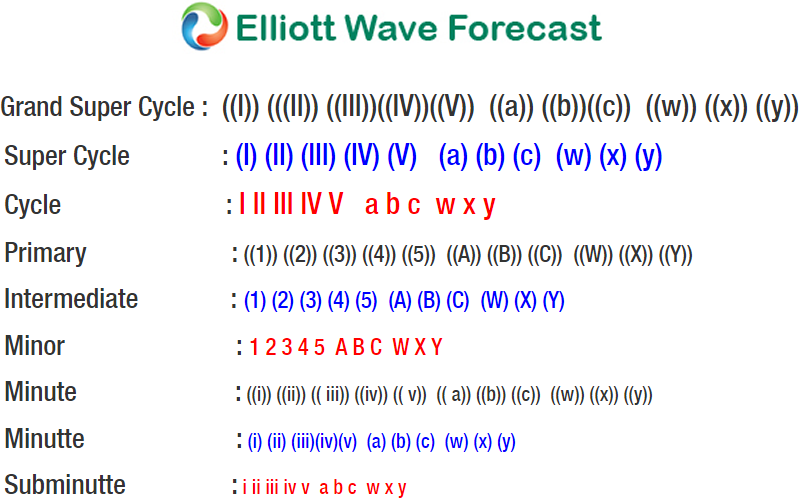
Short term Elliottwave structure of AUDCAD from 3/1 peak (1.025) looks to be showing an impulse structure with a nice 5 waves subdivision where Minuette wave (i) ended at 1.0198, Minuette wave (ii) ended at 1.0235, Minuette wave (iii) ended at 1.0115, Minuette wave (iv) ended at 1.0147, and Minuette wave (v) ended at 1.0098. We can also see momentum divergence at the end of wave (v) as shown by the RSI making lower high while price makes lower low. This 5 waves down form a higher degree Minute wave ((a)) of a zigzag structure. The 5 waves move from 1.025 high doesn’t look to be part of wave C of a FLAT in higher degree structure, which implies that while AUDCAD stays below 1.025, we can see another leg lower in the pair in wave ((c)) to end the zigzag structure. Potential target for wave ((c)) is towards 1.0025 – 1.006 area and from this area we can see pair bouncing again to a new high above 1.02548 or for a 3 wave bounce at least. Above 1.0216 now would suggest 5 wave drop was most likely a FLAT from 3/1 (1.0229) high but break above 1.0254 is needed to confirm this view and negate another leg lower within the pull back.
AUDCAD 1 Hour Chart
If not a member yet, Join us and take advantage of the 50% off special offer now and get new trading opportunities. Through time we have developed a very respectable trading strategy which defines Entry, Stop Loss and Take Profit levels with high accuracy. If you want to learn all about it and become a professional Trader. Elliott Wave Forecast keeps you on right side of the market. We provide Elliott Wave charts in 4 different time frames. 3 live sessions by our expert analysts every day. 24 hour chat room moderated by our expert analysts and much more! Welcome to EWF !
Back


