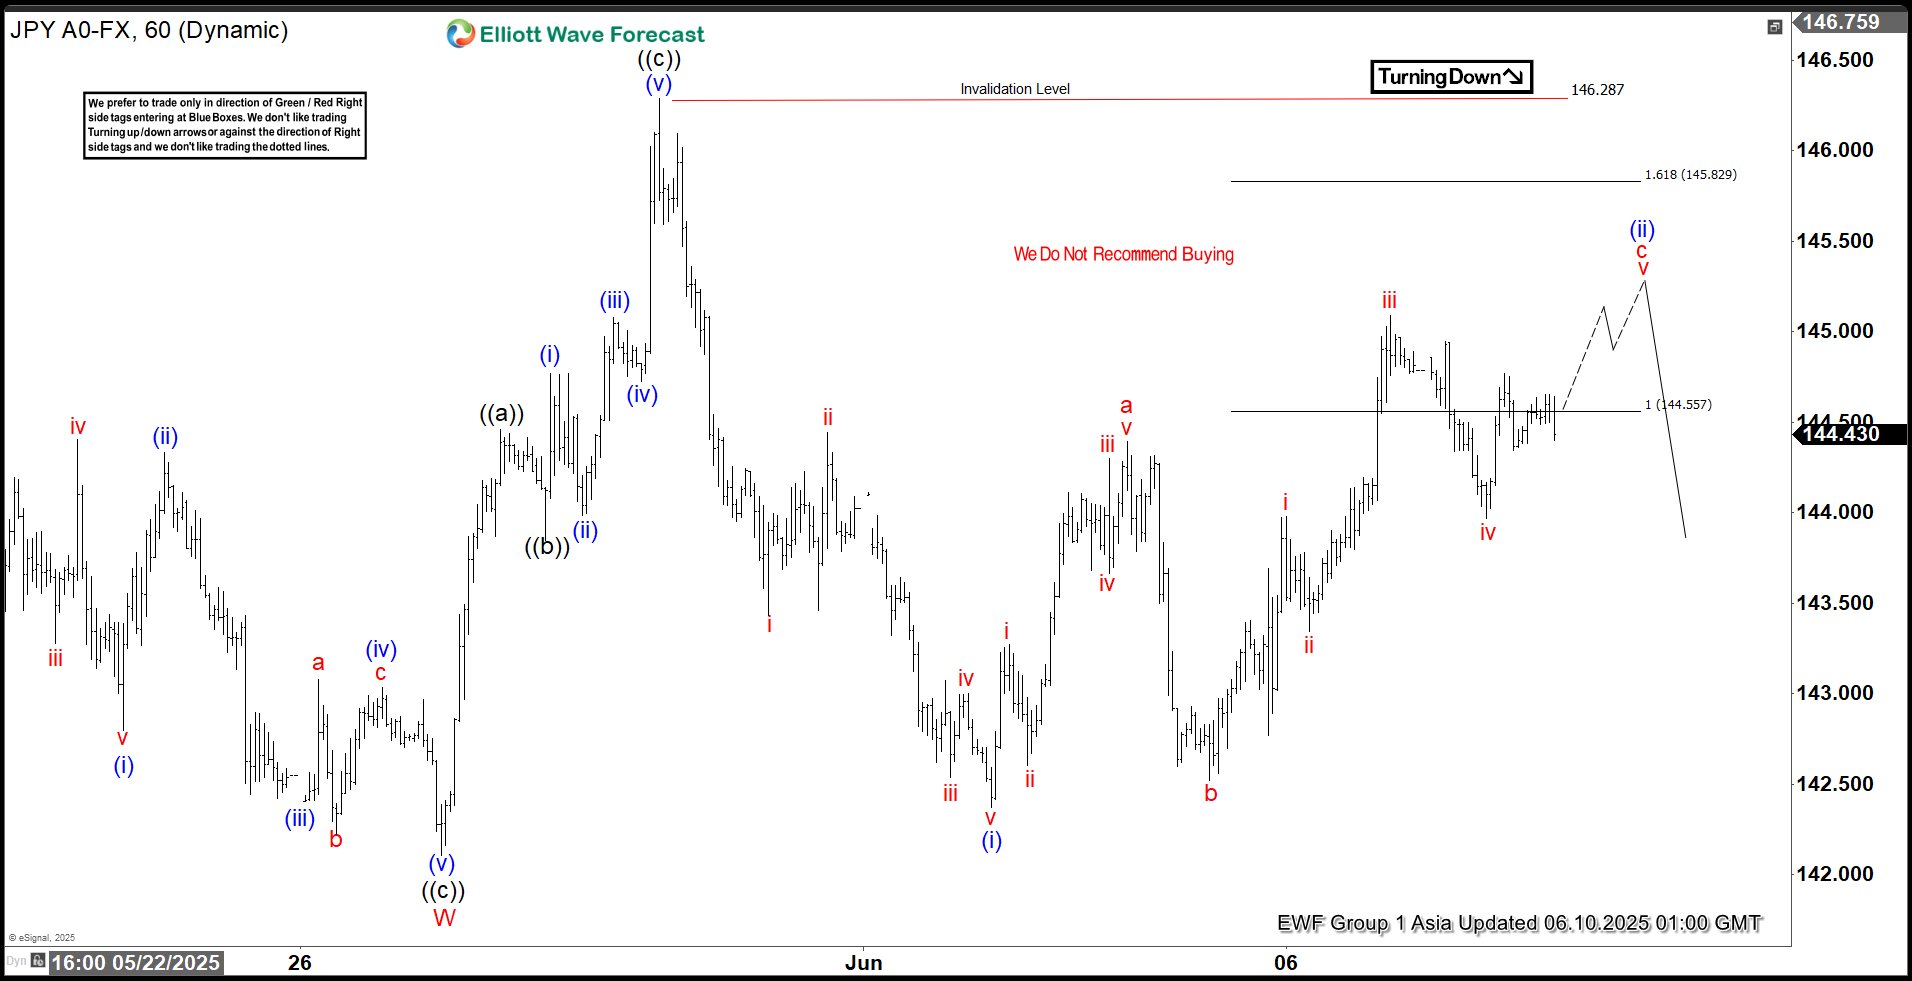
The Elliott Wave chart of USDJPY below shows an a-b-c correction higher to terminate a possible blue wave (ii). As long as the blue wave (ii) terminates below 146.287 the bearish wave count is valid. Traders should be looking for only selling opportunities for the possible move lower.
USDJPY 1 Hour Chart June 10 2025 (Asia Update)
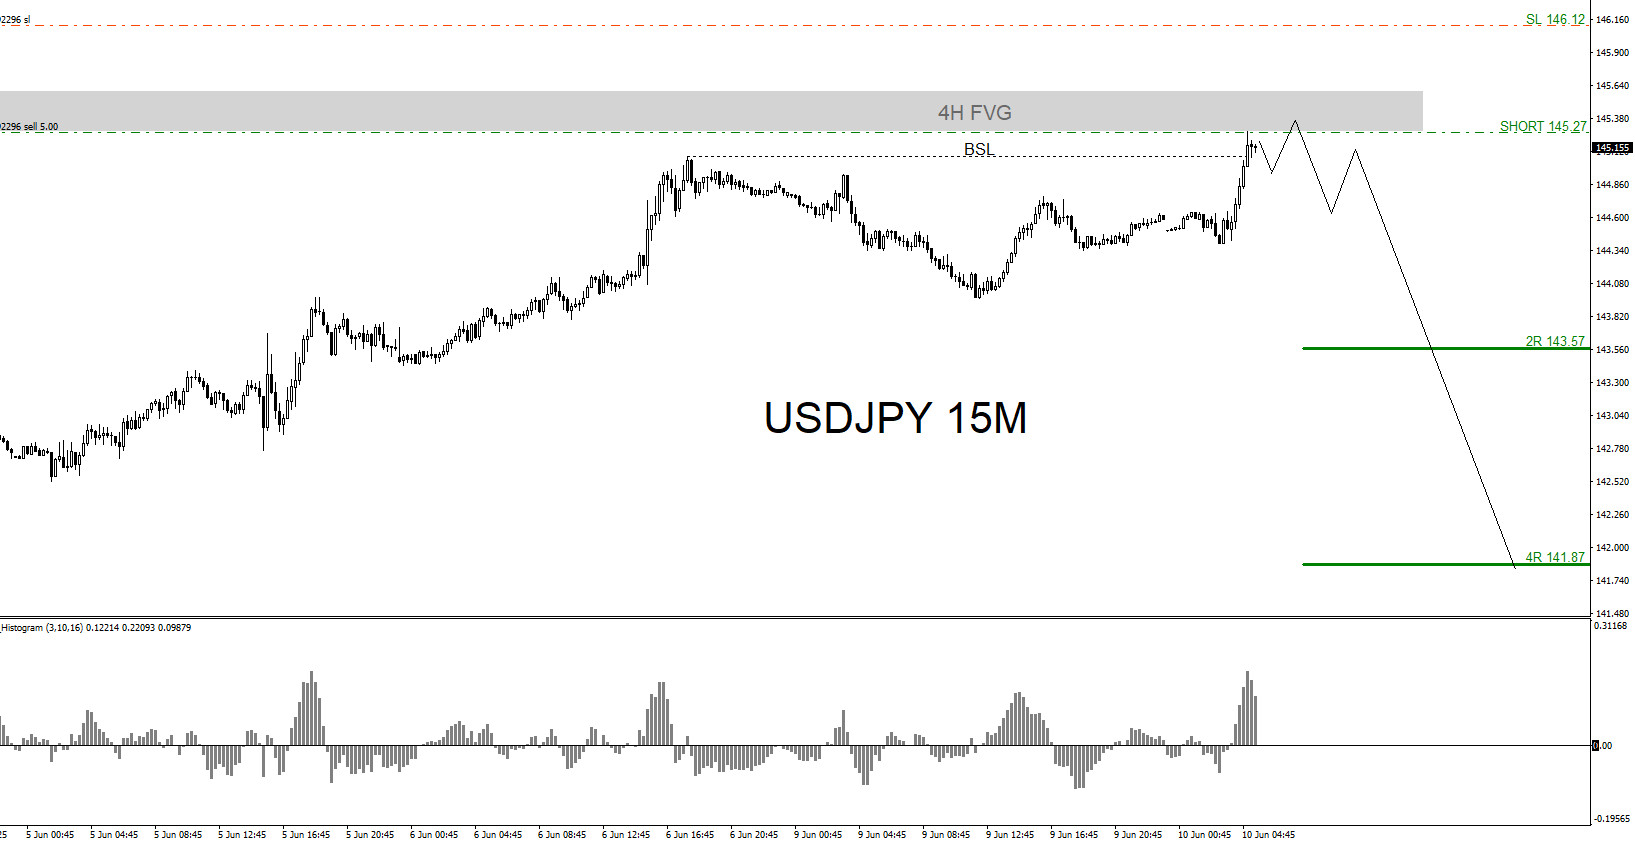
I sold USDJPY at 145.27 with stop loss at 146.12 targeting the 2R and 4R levels. If USDJPY moves lower and hits 2R target will move stops to breakeven/entry and will let it ride to see if will extend lower to the 4R level where I will then close some of the sell position. Only time will tell.
USDJPY 15 Minute Chart June 10 2025
A trader should always have multiple strategies all lined up before entering a trade. Never trade off one simple strategy. When multiple strategies all line up it allows a trader to see a clearer trade setup. We at EWF never say we are always right. No market service provider can forecast markets with 100% accuracy. Only thing we at EWF 100%, is that we are RIGHT more than we are WRONG.
Of course, like any strategy/technique, there will be times when the strategy/technique fails so proper money/risk management should always be used on every trade. Hope you enjoyed this article and follow me on social media for updates and questions> @AidanFX
At Elliottwave-Forecast we cover 78 instruments (Forex, Commodities, Indices, Cryptos, Stocks and ETFs) in 4 different time frames and we offer 5 Live Session Webinars everyday. We do Daily Technical Videos, Elliott Wave Trade Setup Videos and we have a 24 Hour Chat Room. Our clients are always in the loop for the next market move.
Try Elliottwave-Forecast for 14 days !!! Just click here –> 14 day trial


