For decades, investors viewed Gold and Silver as the ultimate insurance policy. Traditionally, precious metals and equities moved in opposite directions, providing a natural hedge for portfolios. However, the market dynamics of 2024 and 2025 completely rewrote the rulebook. As we navigate the first quarter of 2026, understanding this new “direct correlation” is vital for protecting your wealth.
The Foundation: Why Metals Traditionally Oppose Stocks
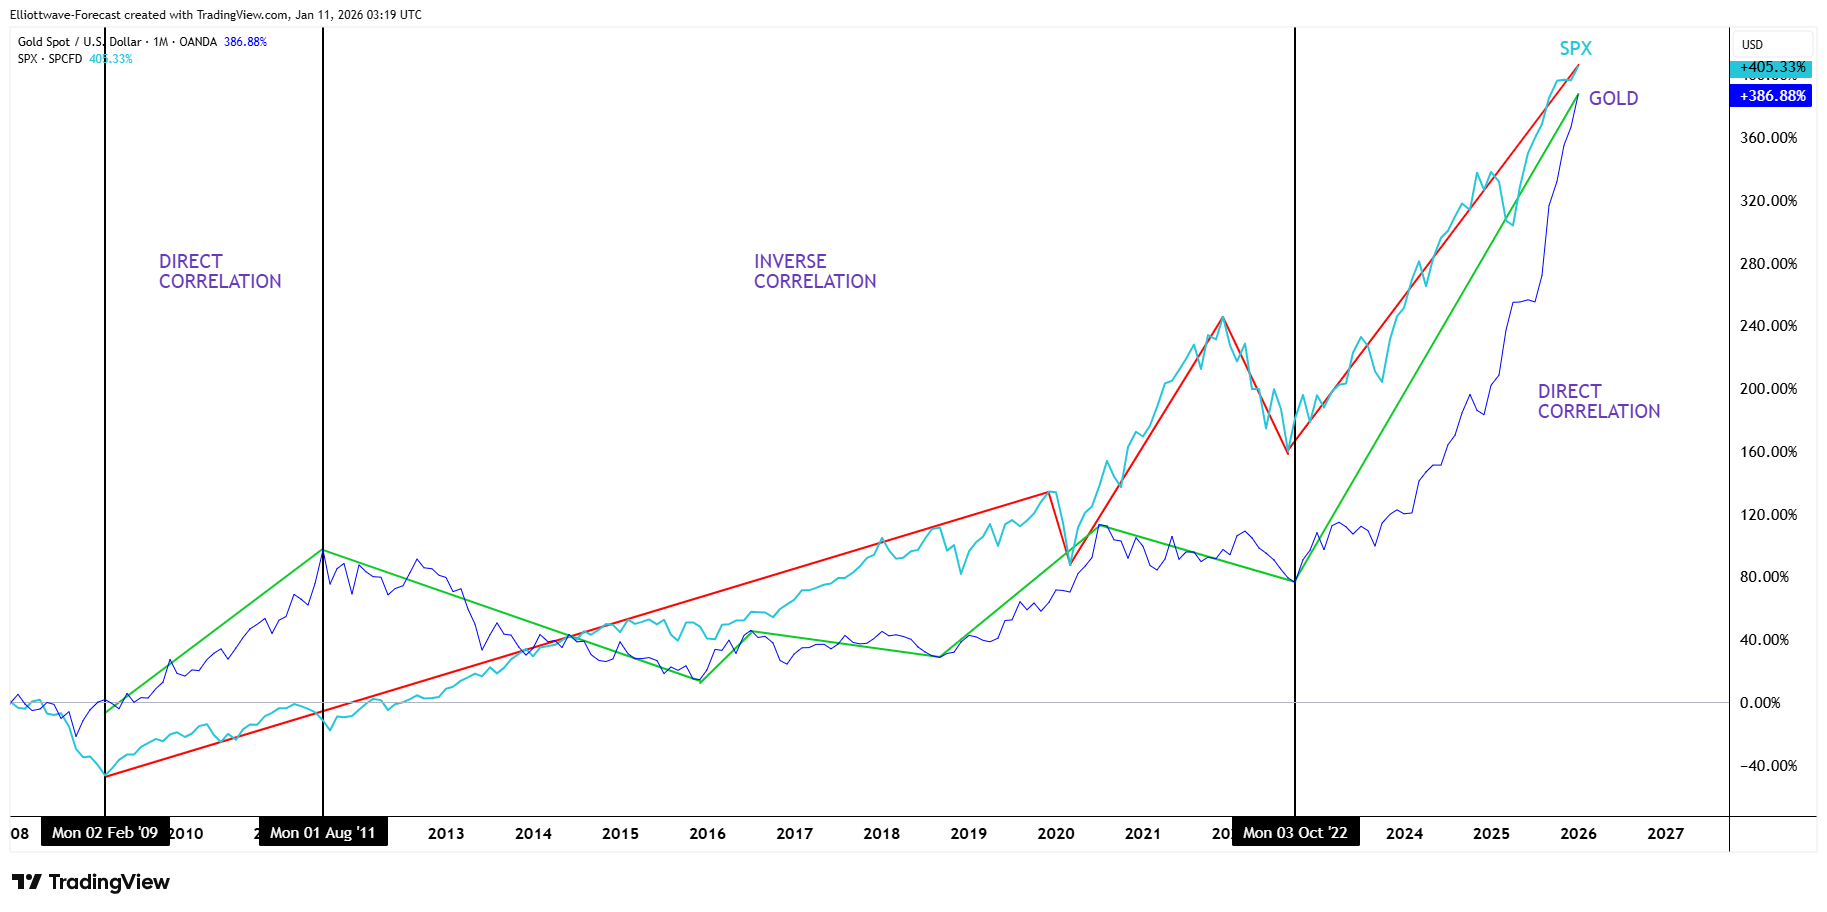
Historically, Gold (1$XAU$) and the S&P 500 (2$SPX$) maintained a strong inverse correlation.3 When the stock market thrived, gold prices usually stalled or fell. This “tug-of-war” occurred for three main reasons:
-
Risk Sentiment: Investors aggressively pursue growth (stocks) during “risk-on” periods and flee to gold (safety) during “risk-off” cycles.
-
Opportunity Cost: Because gold pays no dividends, high stock returns make holding the metal “costly” in terms of missed gains.
-
Monetary Stability: Gold acts as a hedge against a weak dollar. Consequently, a currency crisis typically hurts stocks while simultaneously boosting gold.
The Great Breakdown of Gold in 2024 and 2025
The investment playbook broke recently. This was not a sudden shift, but rather an acceleration that consolidated a new, aggressive trend:
-
The 2024 Anomaly: For the first time in the modern era, Gold and the S&P 500 both gained over 25% in the same year. In August 2024, their correlation hit a record 0.91, as they moved in almost total synchrony.
-
The 2025 Consolidation: Last year, the market witnessed simultaneous all-time highs. Stocks rose on the AI boom, while Gold climbed due to mounting fears regarding the massive US fiscal deficit.
 Why Did This Happen?
In a startling turn for early 2026, the traditional rulebook has been discarded. We are currently seeing a positive correlation, where both Gold and the S&P 500 reach all-time highs simultaneously (with gold hovering around $4,500 – $5,000 per ounce). This breakdown is driven by three modern forces:
-
Global Debt & Dollar Debasement: National debt has reached levels that trigger fears of permanent inflation. As a result, institutions buy the S&P 500 for earnings growth and Gold to protect against a devaluing currency. They no longer choose one or the other; they buy both.
-
Central Bank Dominance: Central banks worldwide are diversifying their reserves away from Treasuries at a record pace. This “non-cyclical” buying pressure keeps gold prices high, regardless of how well Wall Street performs.
-
Interest Rate Expectations: Anticipation of Fed rate cuts in Q1 2026 has reduced real yields. This makes stocks more valuable (cheaper debt) and gold more attractive (lower opportunity cost) at the same time.
Q1 2026 Outlook: What Should We Expect?
As we advance through the first quarter of 2026, the market sits at a critical junction. The primary question is: will this direct correlation persist, or will we return to the old dynamics?
The Case for Continued Direct Movement
Analysts expect this direct correlation to hold through most of Q1. Specifically, as long as the AI-driven earnings boom continues and central banks keep accumulating gold, both assets will benefit from the massive global liquidity in the system.
The Return to Decoupling
Conversely, we will likely see a “Grand Decoupling” toward the end of the year. Historically, periods where “everything rallies” mark the final stage of a market cycle. If a sudden economic shock occurs, investors will liquidate winning stock positions to cover losses, while Gold will separate to become the only remaining safety net.
Strategic Summary for Investors
The current movement “in unison” is an anomaly fueled by debt and liquidity. While it is profitable now, astute investors must prepare for an eventual return to the mean. Once the market realizes that corporate growth cannot outrun structural currency debasement forever, the traditional inverse correlation will reclaim its throne.
Transform Your Trading with Elliott Wave Forecast!
Ready to take control of your trading journey? At Elliott Wave Forecast, we provide the tools you need to stay ahead in the market:
✅ Blue Boxes: Stay ahead in the market with fresh 1-hour charts updated four times daily, daily 4-hour charts on 78 instruments, and precise Blue Box zones that highlight high-probability trade setups based on sequences and cycles.
✅ Live Sessions: Join our daily live discussions and stay on the right side of the market.
✅ Real-Time Guidance: Get your questions answered in our interactive chat room with expert moderators.
🔥 Special Offer: Start your journey with a 14-day trial for only $0.99. Gain access to exclusive forecasts and Blue Box trade setups. No risks, cancel anytime by reaching out to us at support@elliottwave-forecast.com.


