The VanEck Semiconductor ETF (SMH) is an exchange-traded fund that tracks a market-cap weighted index composed of 25 of the largest U.S.-listed semiconductor companies. The top holdings of SMH include companies like NVIDIA, Taiwan Semiconductor Manufacturing, Broadcom Inc., Texas Instruments, QUALCOMM, ASML Holding N.V., Applied Materials, Inc., Lam Research Corporation, Micron Technology, Inc., and Advanced Micro Devices, Inc.
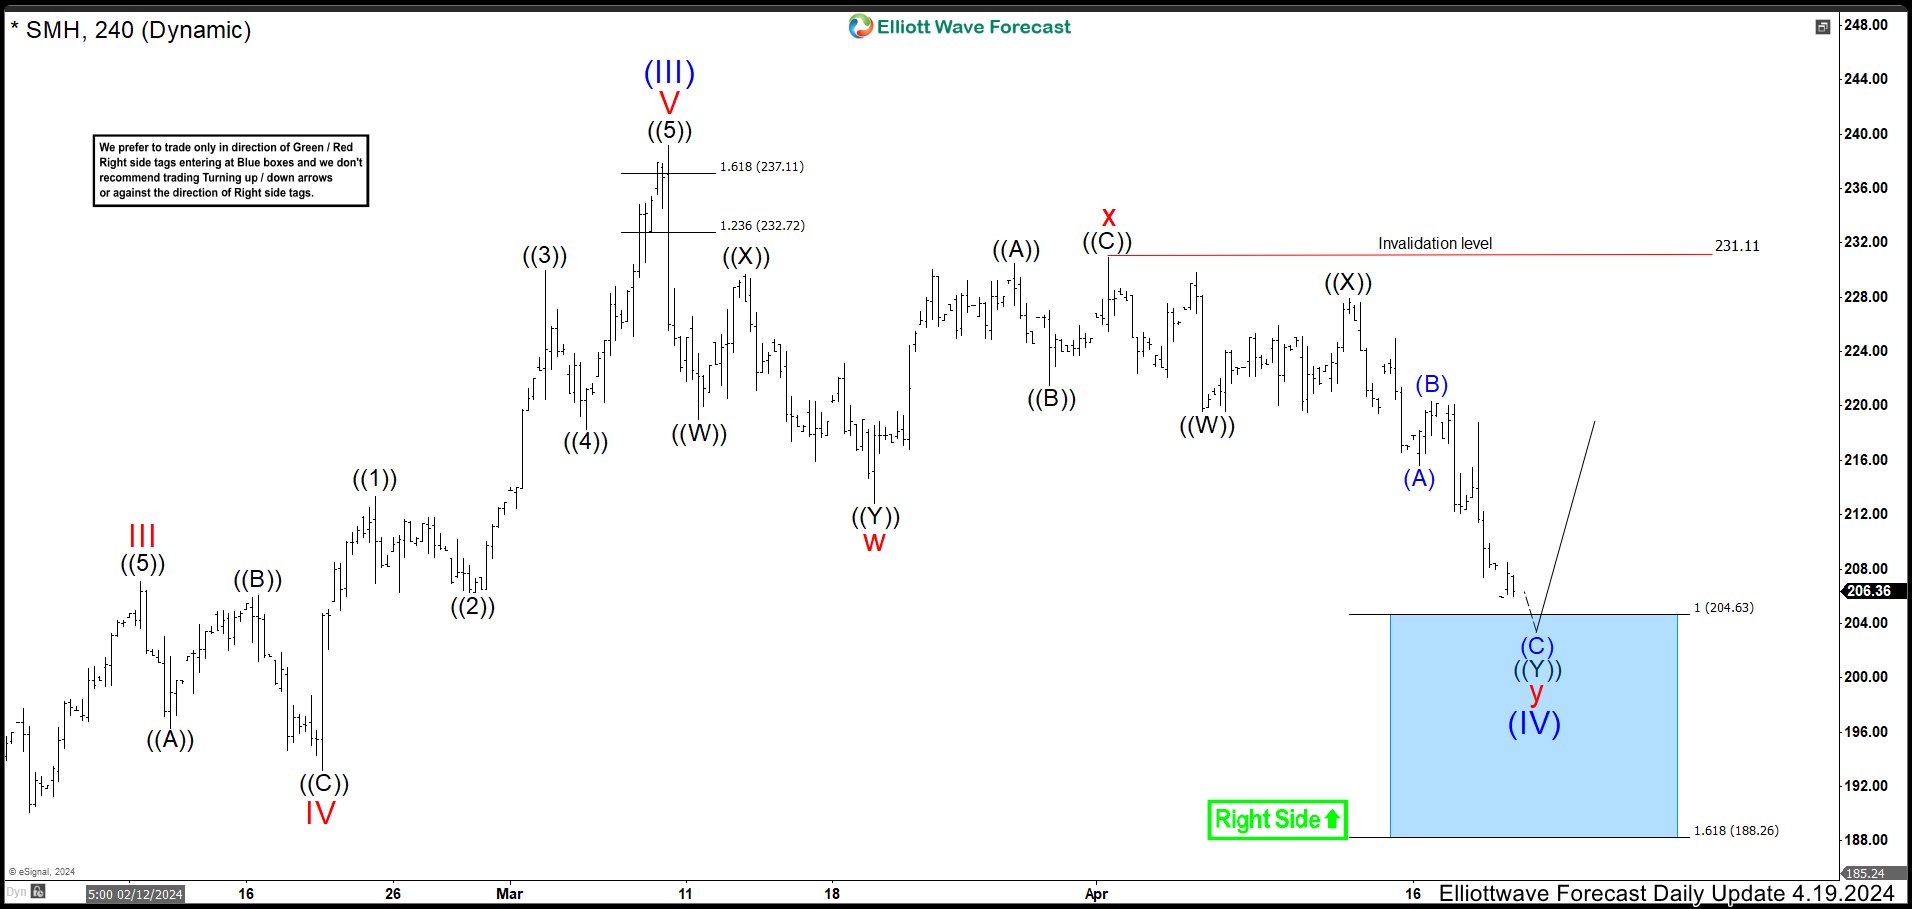
SMH 4 Hour Chart April 19th
In March 2024, the ETF made a peak at 239.14 high and we called as wave (III). Then, the market started a pullback and we called a double correction structure. Down from the peak, we can see 3 swings that ended wave w at 212.82 low. Another 3 swings bounced to finish wave x at 230.95 high. From here, we were looking for 3 swings more to the downside to reach 204.63 – 188.26 area. In the blue box, we were expecting that buyers appear to call wave y and wave (IV) ended and resume the rally in wave (V).
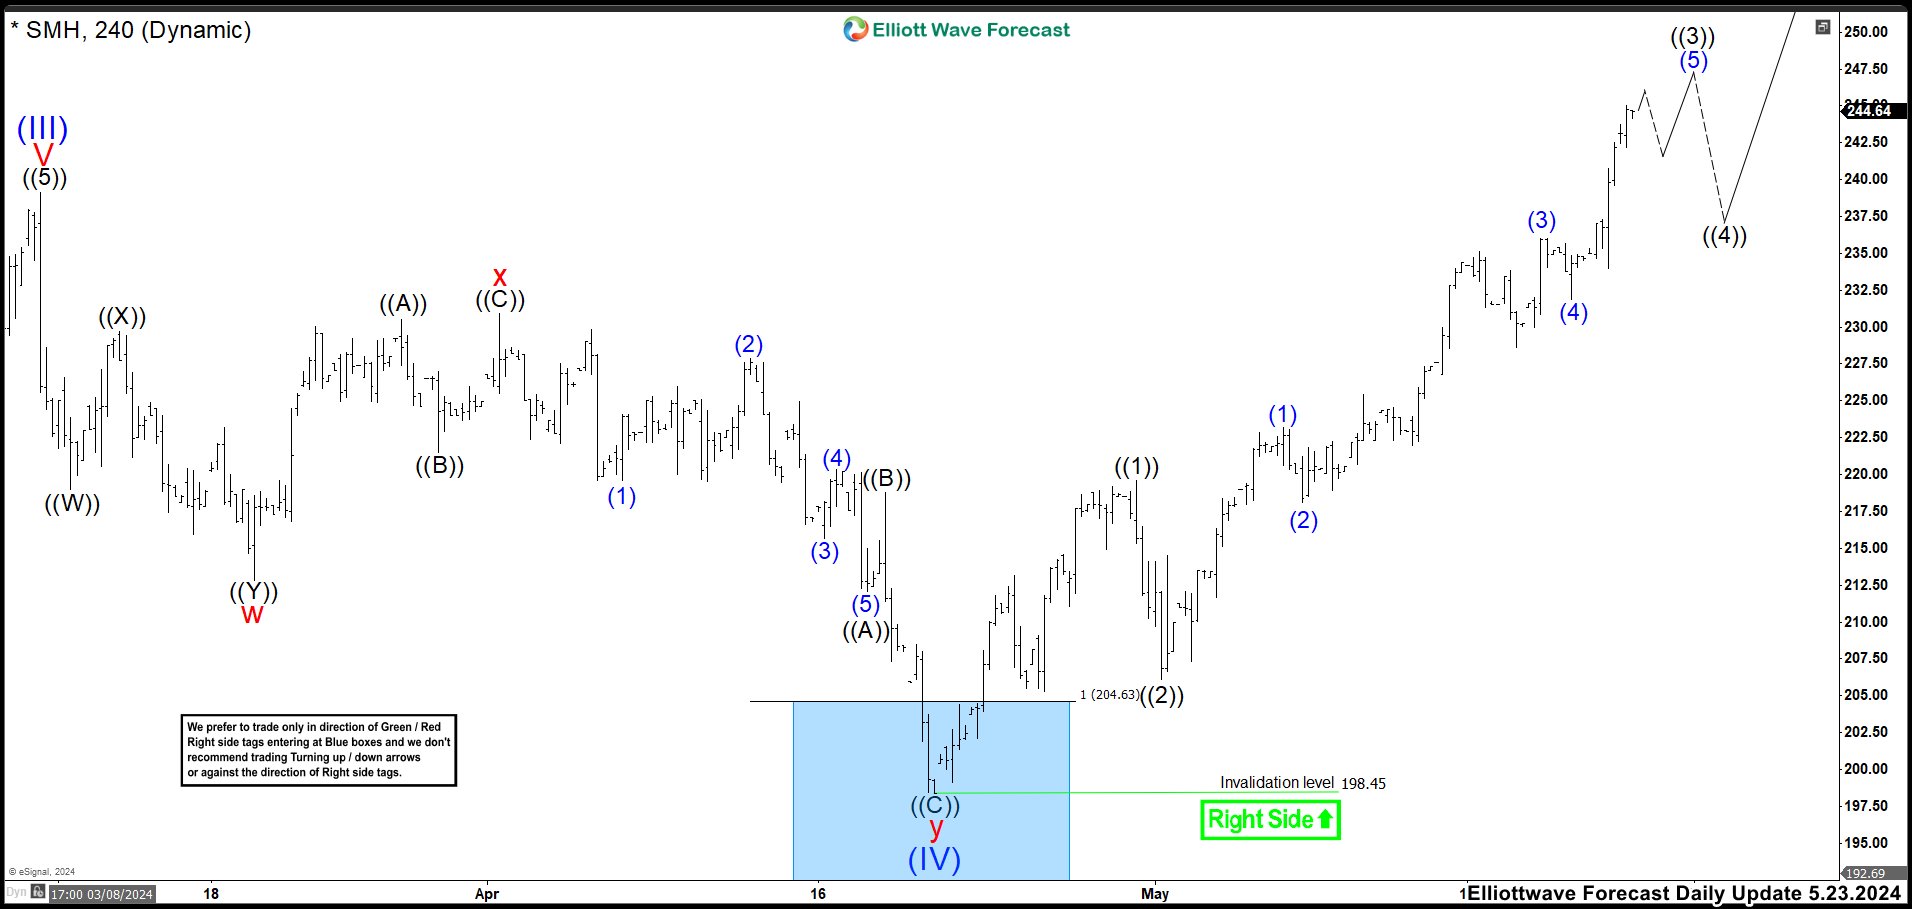
SMH 4 Hour Chart May 23th
After a month, We can see SMH reached the blue box ended wave (IV) at 198.41 low and rally as expected. The ETF is developing an impulse as wave I of (V) and we see the structure incomplete at the moment. The uptrend ended wave ((1)) of I at 219.62 high. Then we had a fast correction as wave ((2)) ending at 206.11 low. The market remained up with a strong momentum in wave ((3)). Wave (1) of ((3)) ended at 223.18 high. Wave (2) correction at 218.11 low. The rally continued ending wave (3) at 236.04 high and wave (4) pullback at 231.87 low.
After NVDA earnings results, SMH broke higher above wave (III) peak confirming more upside extension. Currently, wave (5) of ((3)) could be near to end. When we see a strong correction as wave ((2)), wave ((3)) should be ended and we would expect 3, 7 or 11 swings correction to complete wave ((4)) before resuming to the upside in wave ((5)) of 1. The strategy is looking for buying opportunities after wave ((4)) is completed to trade wave ((5)) higher.
Elliott Wave Forecast
www.elliottwave-forecast.com updates one-hour charts 4 times a day and 4-hour charts once a day for all our 78 instruments. We do a daily live session where we guide our clients on the right side of the market. In addition, we have a chat room where our moderators will help you with any questions you have about what is happening in the market.
14 day Trial costs $9.99 only. Cancel anytime at support@elliottwave-forecast.com
Back


