On January 4 2024 EURJPY was showing signals that the pair would extend higher. Below I will explain the reasons why I entered BUY/LONG trade.
Buy Trade Setup
1. Price enters the 1 Hour bullish demand zone. (Gray box)
2. Price sweeps a liquidity level faking out sellers and fuelling the buyers. (Black line/Liquidity Grab)
3. Bullish divergence pattern forms on RSI and in the demand zone signalling a price reversal higher. (Red)
4. Buy/Long trade entered after a clear visible bounce higher confirming a higher low formed and where stops was set looking for targets above the days high.
EURJPY 1 Minute Chart January 4 2024

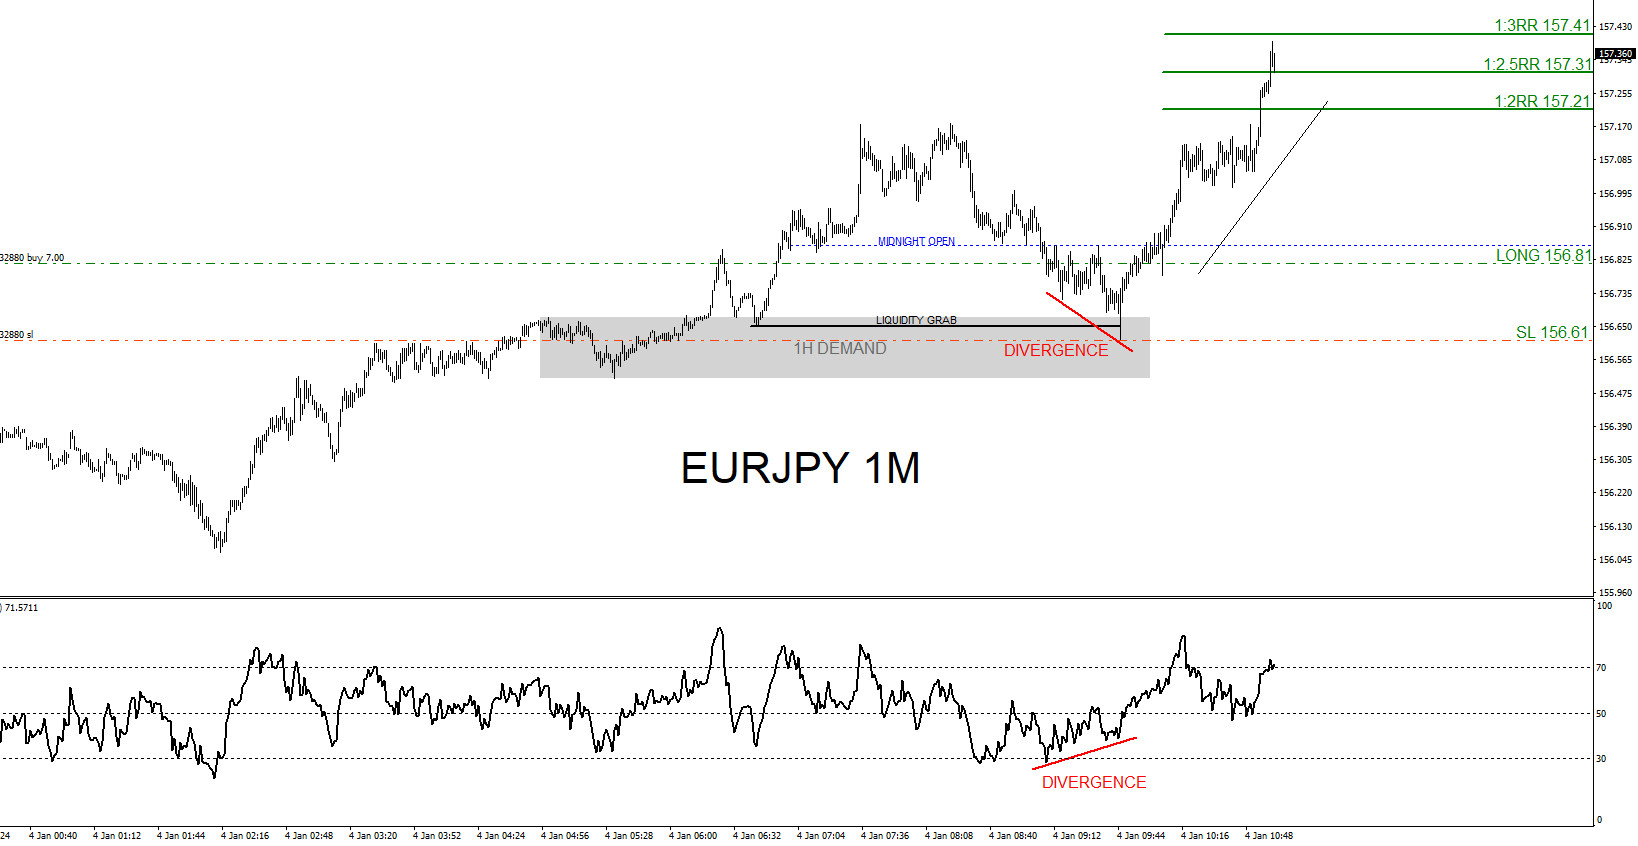
Entered the BUY trade at 156.81 with a 20 pip stop loss at 156.61. EURJPY moves higher and hits the proposed 1:2RR target at 157.21 and I closed the buy trade at the 157.31 1:2.5RR Target for +50 pips +2.5% gain (Risking 1% on every trade).
A trader should always have multiple strategies all lined up before entering a trade. Never trade off one simple strategy. When multiple strategies all line up it allows a trader to see a clearer trade setup. If you followed me on social media you too could have caught the EURJPY move higher.
Of course, like any strategy/technique, there will be times when the strategy/technique fails so proper money/risk management should always be used on every trade. Hope you enjoyed this article and follow me on social media for updates and questions> @AidanFX
At Elliottwave-Forecast we cover 78 instruments (Forex, Commodities, Indices, Cryptos, Stocks and ETFs) in 4 different time frames and we offer 5 Live Session Webinars everyday. We do Daily Technical Videos, Elliott Wave Trade Setup Videos and we have a 24 Hour Chat Room. Our clients are always in the loop for the next market move.
Try Elliottwave-Forecast for 14 days !!! Just click here –> 14 day trial


