DOGEUSD promotes the currency as the “fun and friendly Internet currency”. Software engineers Billy Markus and Jackson Palmer launched the satirical cryptocurrency to make fun of Bitcoin and the many other cryptocurrencies boasting grand plans to take over the world. Dogecoin had established a dedicated blog and forum, and its market value has reached US$8 million, once jumping to become the seventh largest electronic currency in the world.
DOGEUSD November Daily Log Chart
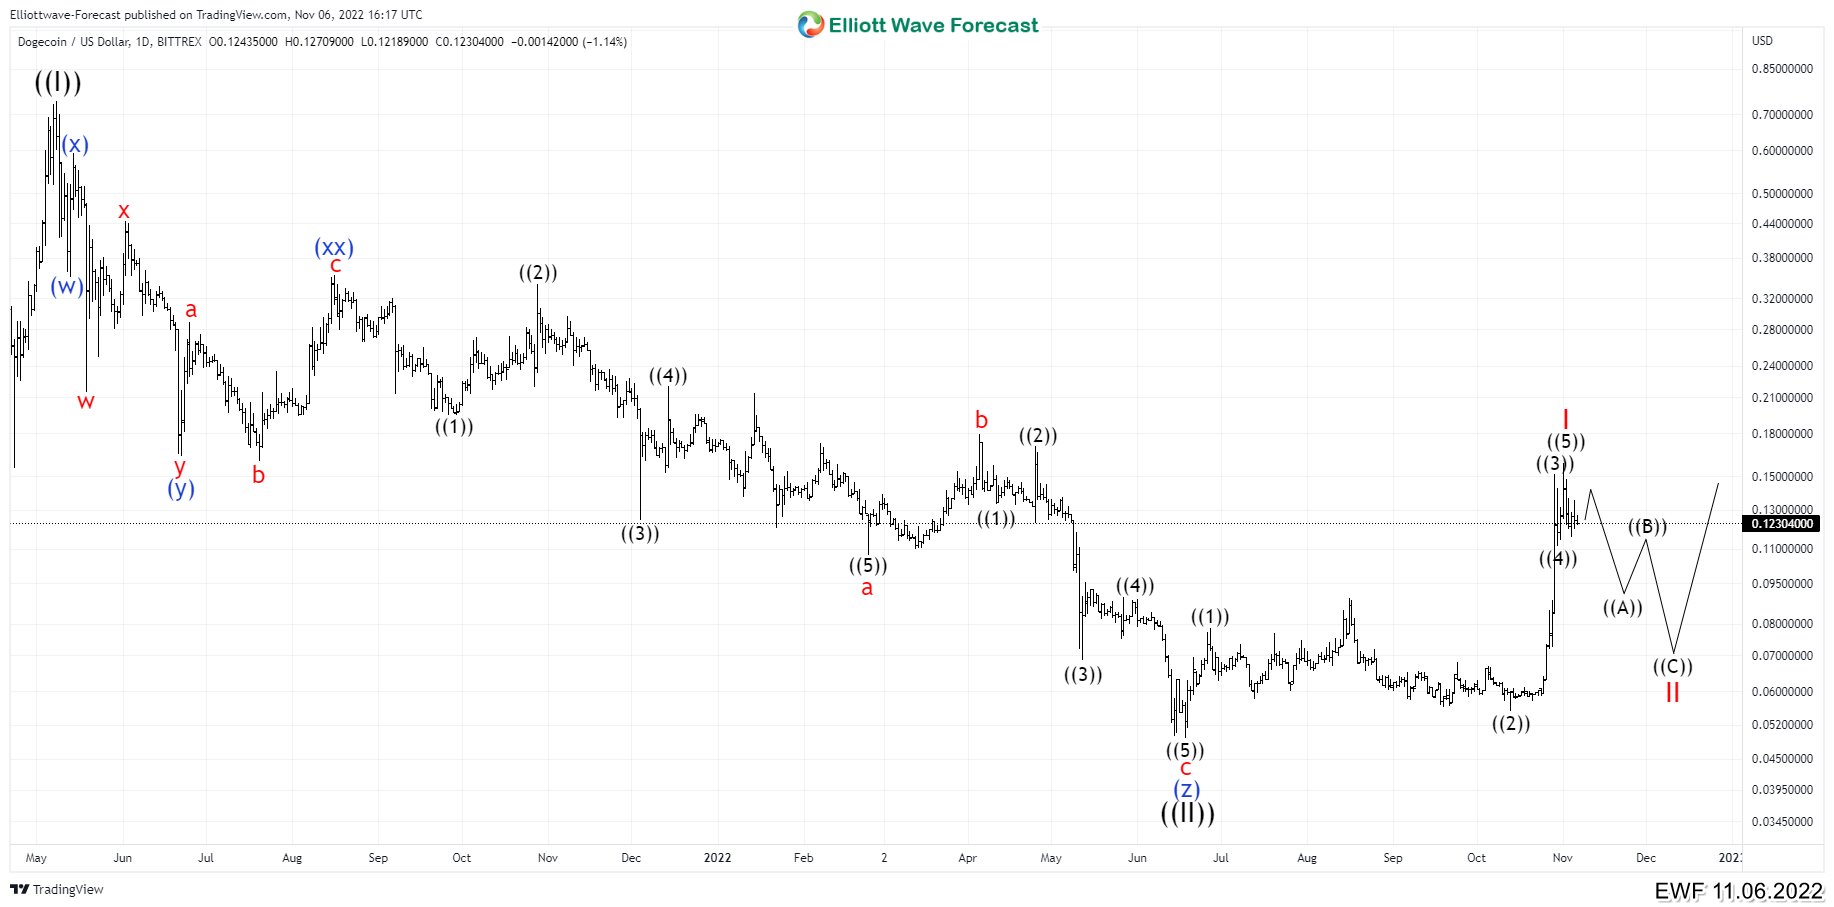
 DOGEUSD completed a bullish cycle in May 2021 peak and since then it held a bearish corrective movement. We present the logarithmic chart of the cryptocurrency in order to identify better the waves. Given the extent of the correction that led Dogecoin to lose over 93% of its value, we can see a triple correction structure. Wave (w) ended a sharp drop at 0.3515. It then had a corrective rally towards 0.5934 to complete wave (x), and finally we had 3 bearish swings to finish wave (y) at 0.1641.
From August 2021, the correction continued after completing another connector as wave (xx) retested at 0.3515. The bearish movement was very prolonged lasting almost a year. We can see a 5, 3, 5 structure to complete wave (z). Wave “a” completed an impulse at 0.1071. The bounce as wave “b” ended at 0.1802 and from there we continue in the downtrend. The market drew a new impulse with an extended wave ((5)) ending at 0.0494 to complete wave “c” of (z) and wave ((II)). (If you want to learn more about double correction or Elliott Wave Theory, follow these links: Elliott Wave Education and Elliott Wave Theory).
Is A New Bullish Cycle Starting?
Apparently, the correction that lasted more than a year of downtrend has come to the end. This conclusion is not due to the bullish structure of this last year, but rather because the RSI has broken all pivots suggesting the correction is over. That is why we drew an impulse as wave I from 0.0494. Although the structure has a form of a flat correction that could take DOGEUSD back below 0.0494, we will take the RSI suggestion that the correction is completed. Therefore, we have an impulse wave I that ended at 0.1640 and we are going to look for a deep retracement to avoid being surprised by a possible break of 0.0494.
For the next few months, we will see a downward correction that reaches levels close to 0.07. A very interesting level due to certain previous supports and resistances that could act as a bounce zone to prevent the cryptocurrency from returning to levels close to 0.0494.
TAKE 14 DAYS TRIAL
Elliottwave Forecast updates one-hour charts 4 times a day and 4-hour charts once a day for all our 78 instruments. We do a daily live session where we guide our clients on the right side of the market. In addition, we have a chat room where our moderators will help you with any questions you have about what is happening in the market.
Let’s trial 14 days for only $9.99 here: I want 14 days trial. Cancel Any time.
Back


