Hello fellow traders. In this technical blog we’re going to take a quick look at the past Elliott Wave charts of Russell 2000 ( $RUT). We’re going to explain the structure and see how we guided our members through this instrument.
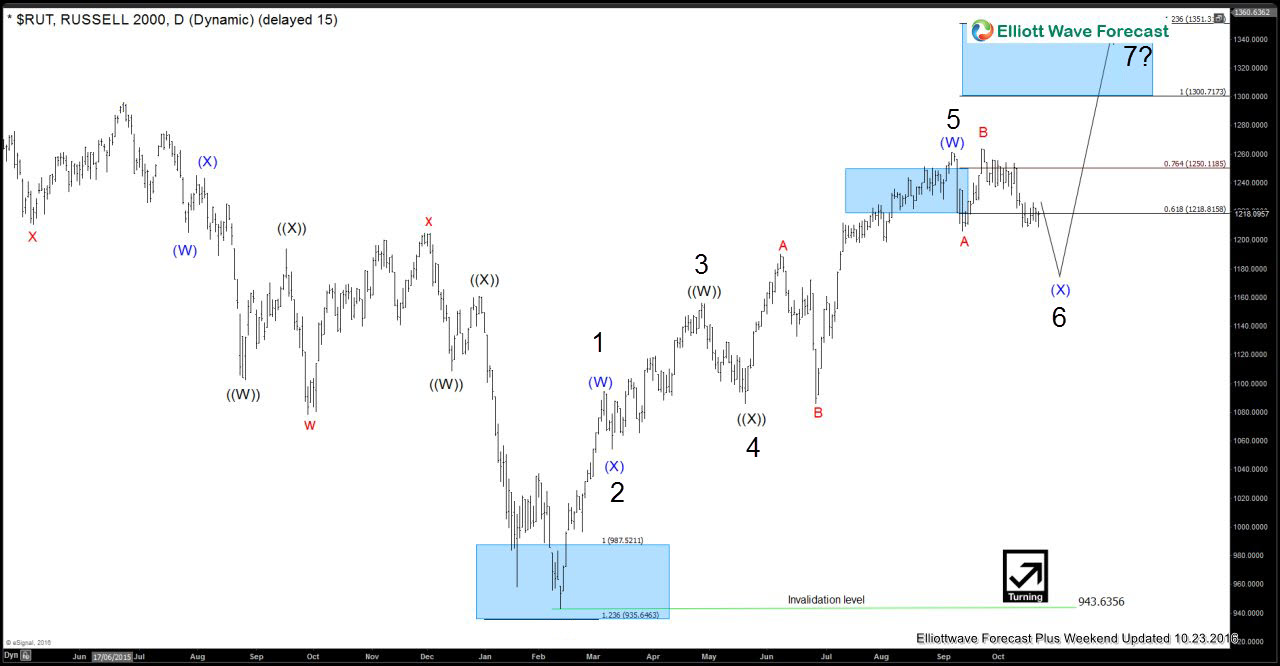
The chart below is $RUT daily update from 10.23.2016. Price structure is showing incomplete bullish sequences in the cycle from the 943.63 low. Fifth swing ended at 1261.11 high as a expanded flat. Our Elliott Wave analysis suggests that the index’s doing 6th swing as irregular Flat as well. Once it completes, another swing up should ideally follow to complete 7 swings at 1300.71-1351.31 area. As our members already know, market moves in 3-7-11 swings sequences and this kind of structures in most cases give us the clear path.

Now let’s take a look at the short term structures.
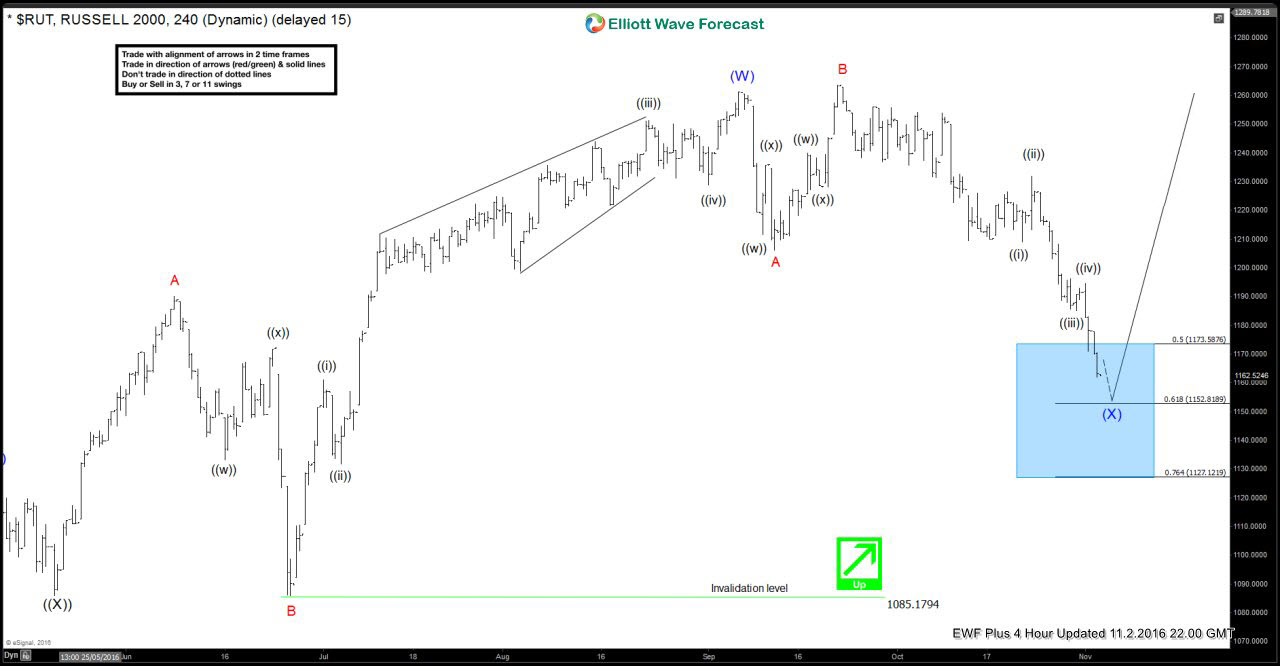
Russell 2000 h4 update, 11.2.2016
The price has reached the 50-61.8 fibs retracement zone at 1173.58-1152.81 where the pull back is expected to complete. The price structure of the pull back looks like Elliott Wave expanded flat. These kind of irregular patterns can be tricky to trade as sometimes they keep extending in wave C. However we suggested our members to avoid selling the index and keep going with the trend: buying the dips in 3-7-11 swings. We favored the long side against the pivot at 1085.179 low.

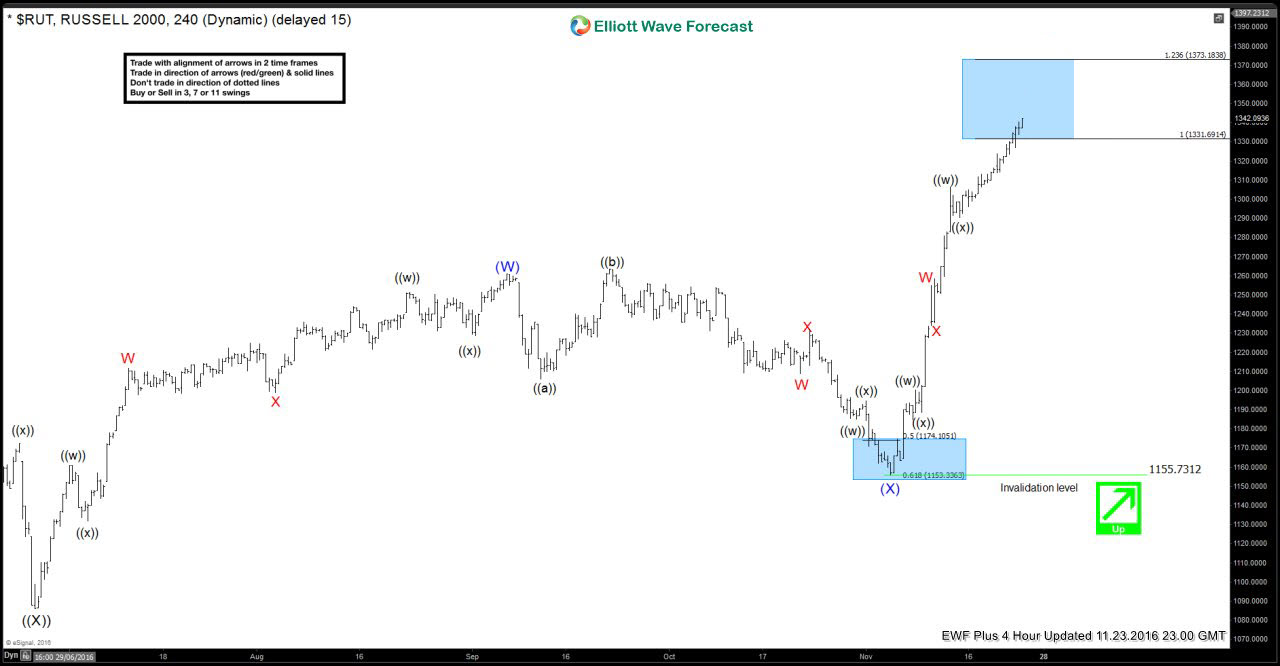
Russel 2000 h4 update 11.23.2016
Eventually the index found buyers at proposed 1173.58-1152.81 area. The index completed (X) blue pull back at the 1155.73 low and made sharp rally from there.

Note: Some labels have been removed in order to protect client’s privileges. If you’re interested in the future path of $RUT you can find Elliott Wave analysis in the membership area of EWF. ( If not a member yet, you have opportunity to take 14 Days Free Trial )
Through time we have developed a very respectable trading strategy. If you want to learn all about it and become a professional Trader, join us now for Free.
Back


