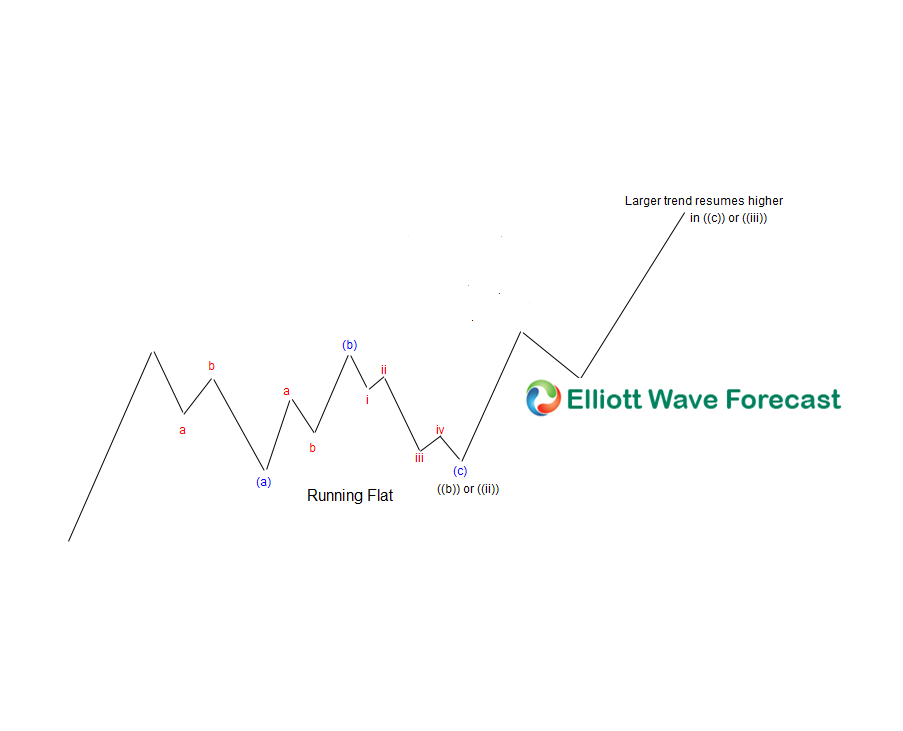
In this Technical blog we are going to take a look at $CL_F (Oil) running flat structure we had from June’s peak, but before we go there lets talk about what “Running FLAT Elliott Wave structure” looks like. As per Elliott Wave Theory, running FLAT is a 3 wave corrective pattern which could be rarely found in the market. In this structure, internal subdivisions are 3, 3, 5 and labelled A, B, C. Waves A and B can have any type of corrective structures, i.e. zigzag, flat, double three or triple three. Whereas, the C wave is always a 5-wave structure, either a motive impulse or an ending diagonal pattern. It is important to note that in Running Flat Elliott Wave Pattern, wave B terminates well beyond the beginning of wave A as in an expanded flat, but wave C fails to travel its full distance, falling short of the level at which wave A ended, which makes its Running. The running flat wave C is normally completed above the Fibonacci extension 100% -123.6% of A related to B, and then continues with the larger trend or produces a reaction of at least 3 waves (if the larger trend doesn’t resume).
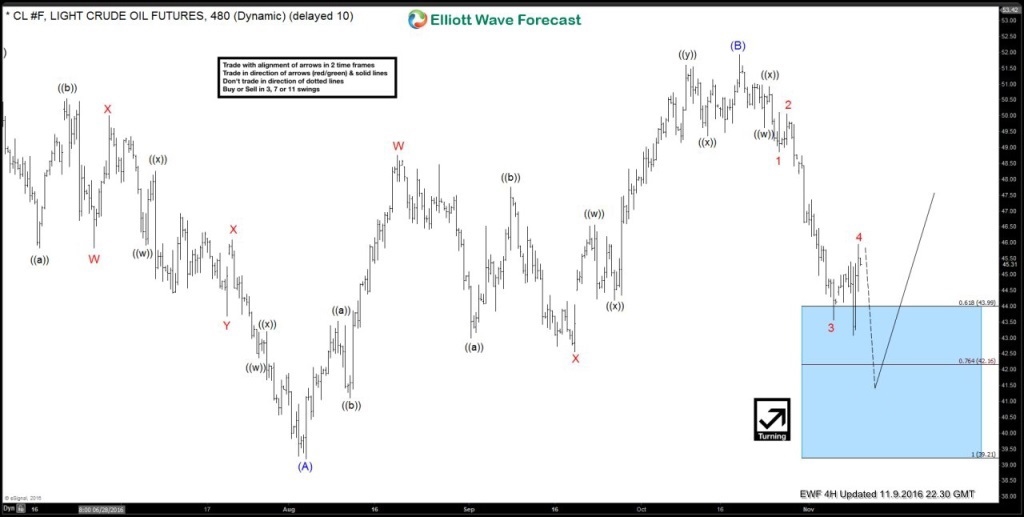
OIL (CL_F) November 9, 4 hour updated chart
The CL_F Light crude oil futures chart below shows preferred Elliott wave forecast from November 9th, 2016. In which the instrument is showing a flat pattern from June 2016 peak, where wave (A) lower in blue unfolded as triple three structure (which is labelled as W,X,Y,Z). Whereas wave (B) in blue ended up with 3 swings bounce (labelled as W,X,Y structure), Below from there instrument was showing 3 swings from the peak suggesting another push lower in the instrument towards 42.3 (76.4% fib retracement) should be seen to end the cycle from (51.90) peak in 5 swings & also to complete the FLAT (3-3-5) structure from Junes peak and then resume the upside for new highs above wave (B) peak (51.90) or to make a larger 3 swing bounce at least to correct the 5 swings from 51.90 peak.
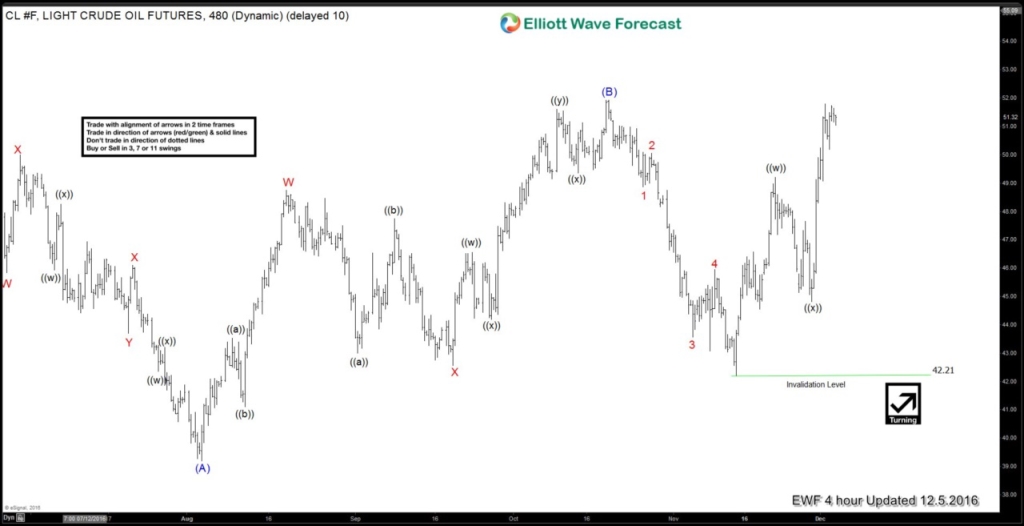
Afterwards then Market gave us the Marginal push lower as expected & instrument found the buyers as expected from our blue box areas & formed the low at (42.20), Since then Market has rallied quite significantly as can be seen in chart below & instrument has rallied more than 1% so far & currently trading above 50 handle.
Keep in mind Market is dynamic and the view can be change in the mean time but we have developed a special skill to identify these types of complex correction before they takes place in market based on correlations, cycles & pivots. If you want to learn more join us through Free 14 day trial.
Back


