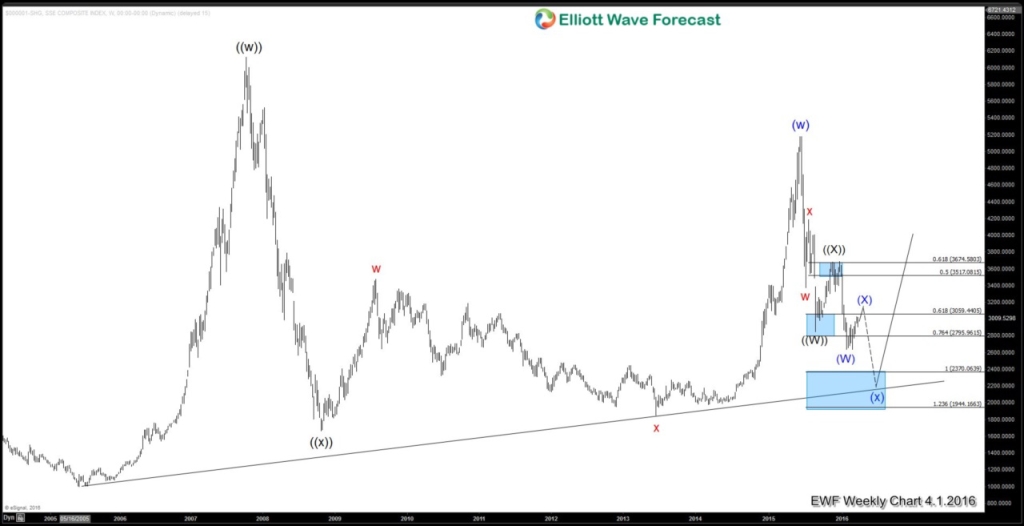
Last year, in our video dated November 2, 2015 we warned our viewers that the Chinese stock market still has more downside to go. We argued that Shanghai Composite Index may retest the 2008 low towards 1944 – 2370 area. The forecast proved accurate and the Chinese stock market resumed a strong selloff in the first one and half months in 2016. The trigger at that time was a combination of Yuan depreciation and also capital flight from China which gives pressure to Chinese stock market.
With the rising prominence of China in the world economy, it’s no surprise to see other global indices in America, Europe and Asia also experiencing strong selloff during the same period. They are after all just 1 market. We updated the state of Shanghai Composite Index in our article dated Jan 13, 2016 In this article, we continue to argue that the downside in the Chinese market is not yet over.
In late January 2016, speculation started to emerge that ECB and BOJ would expand the quantitative easing program to battle deflation. This speculation provided support to the risk environment and indices started to recover until today. BOJ instead opted to experiment with Negative Interest Rate Policy while ECB did expand the asset purchase to €80 billion / month. Indices have continued to recover from the lows in early February until today.
Yet, our view of the Chinese stock market remains the same. We still believe that the downside in Shanghai Composite Index is not over. With a positive correlation between Shanghai Composite and other global indices, this suggests if we can forecast the turn lower in Shanghai Composite, then we can also have some ideas on when to expect a turn in other global indices.
Weekly chart of Shanghai Composite Index 4.1.2016
From the weekly chart above, rally from Oct 2008 low to June 2015 is in 3 swing and ended wave (w) at 5178.2. Wave (x) decline from there is so far in 5 swings, and the internal of wave (x) is proposed to be unfolding in a 7 swing WXY structure where wave “w” ended at 3373.54, wave “x” ended at 4184.45, and wave “y” is currently in progress. Near term, we think that once wave (X) bounce is complete, the index should resume the decline lower in wave ((Y)) of “y” towards 1944 – 2370 area. This move lower should also end the cycle from June 2015 peak and we can see a bigger bounce or a new long term bullish cycle from the area above.
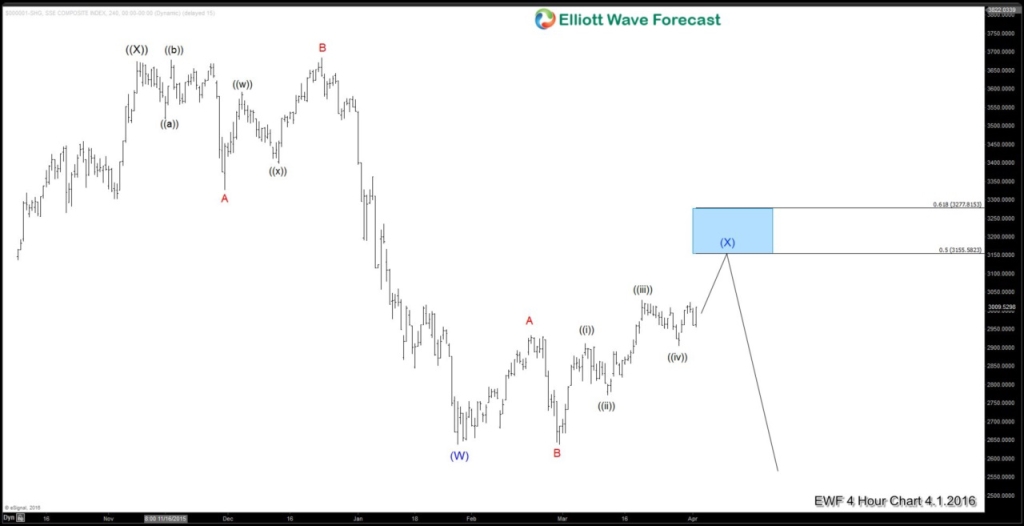
4 Hour chart of Shanghai Composite Index 4.1.2016
From the low in Jan 27, 2016, we labelled it as wave ((w)) at 2638.3, the Index rallied as a flat structure where wave A ended at 2933.8, wave B ended at 2639, and wave C is in progress as 5 waves towards 3155.5 – 3277.8 area before the decline resumes to new lows or at least in 3 waves pullback.
Conclusion: We believe Shanghai Composite Index can show the path to global indices. Looking at the Shanghai Composite Index weekly chart, we believe that the Index still has more downside to come and that the recovery from early February is just a correction within the bearish cycle from 2015 peak. Looking at the 4 hour chart, we think that the Index has scope to extend one more swing higher to finish wave ((v)) of C flat towards 3155 – 3277 before the decline resumes. The risk environment and global indices therefore can extend a little bit higher in April before turning lower.
If you enjoy this article, feel free to read other technical articles at our Technical Blogs and also check Chart of The Day. For further information on how to find levels to trade forex pairs, other indices, and commodities using Elliottwave, take our FREE 14 Day Trial. We provide Elliott Wave chart in 4 different time frames, up to 4 times a day update in 1 hour chart, two live sessions by our expert analysts, 24 hour chat room moderated by our expert analysts, market overview, and much more!
Back


