The Uranium Miners ETF (URA) offers targeted exposure to global uranium mining and exploration companies. It provides investors with opportunity to capture the sector’s long‑term growth potential as nuclear energy demand accelerates. By tracking a concentrated basket of producers, developers, and related equities, URA provides a focused way to participate in the structural tightening of the uranium market. In this article, we will explore the long term technical outlook for the ETF.
URA Elliott Wave Chart Monthly Chart
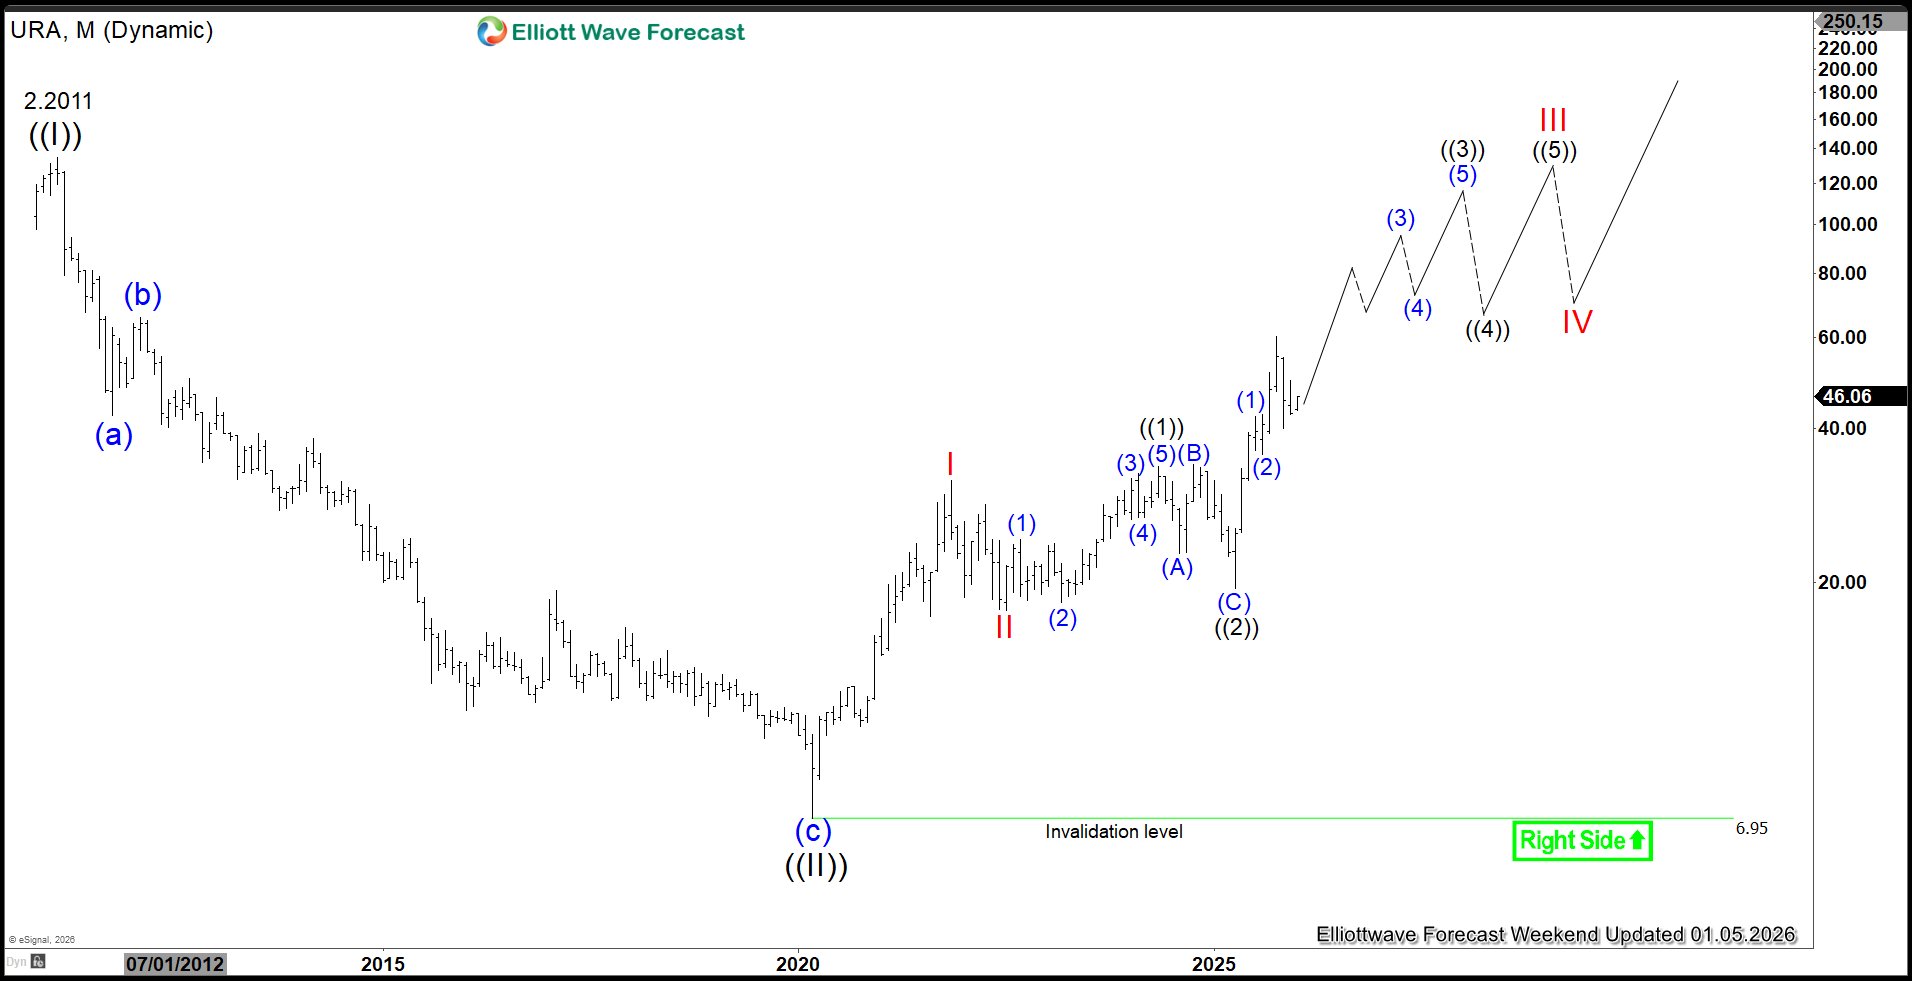
The monthly Elliott Wave chart of the Uranium Miners ETF (URA) indicates that wave ((II)) of the Grand Super Cycle completed at $6.95. From this low, the ETF began a new wave ((III)) advance, unfolding as an impulsive structure with a nested sequence. From wave ((II)), wave I topped at $31.60, followed by a corrective wave II that bottomed at $17.65. URA then formed a nest with wave ((1)) peaking at $33.66 and wave ((2)) pulling back to $19.50. As long as URA holds above $19.50, and especially above the key pivot at $6.95, pullbacks are expected to find support.
URA Daily Elliott Wave Chart
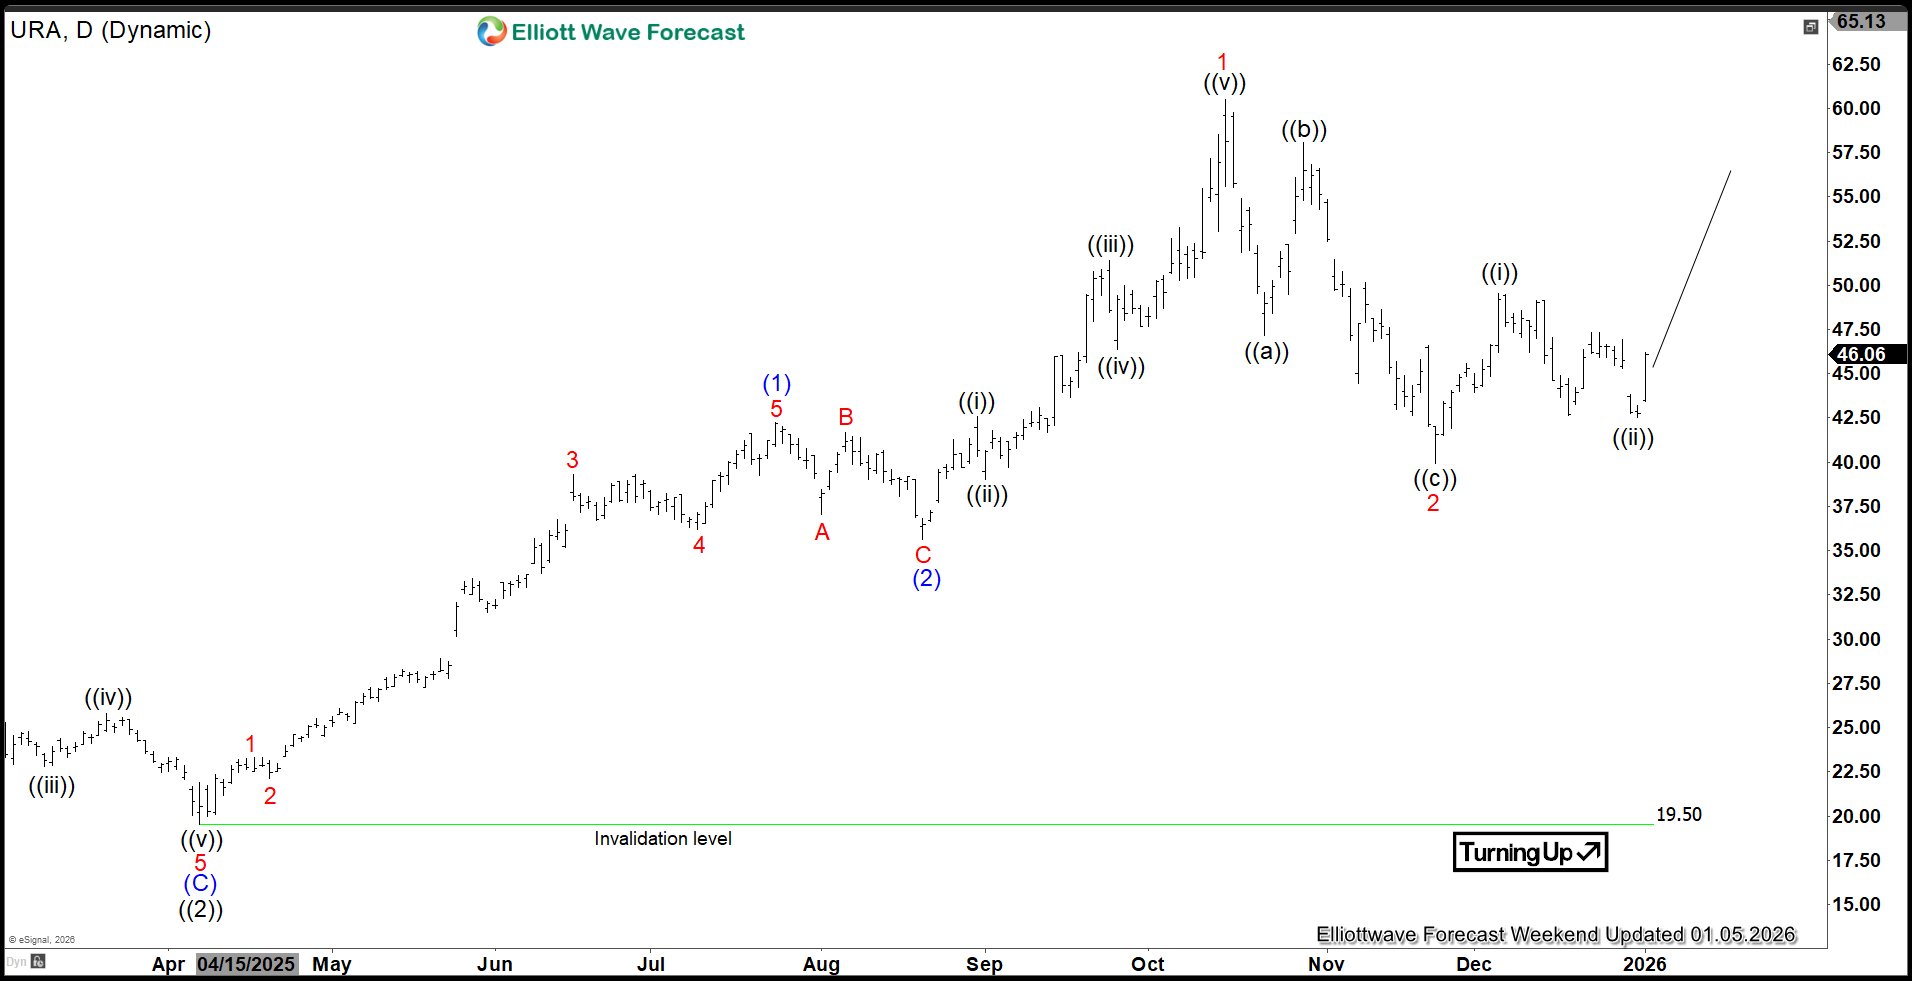
The daily chart of the Uranium ETF shows that the rally from the wave ((2)) low on April 7, 2025 is unfolding as an impulsive advance with a nested structure. From that low, wave (1) completed at $42.22, followed by a wave (2) pullback that bottomed at $35.64. The ETF then accelerated higher in wave (3), with wave 1 of (3) peaking at $60.51. The subsequent wave 2 of (3) pullback is proposed to have completed at $39.95. As long as the key pivot at $19.50 holds, pullbacks should find support, and the ETF should continue extending higher.
Uranium ETF Elliott Wave Video
Stay ahead of the next move in forex, stocks, and crypto. Unlock regular market updates, forward‑looking analysis, and actionable insights with a 14-day trial.
