In this article, we look at incomplete sequences in Palladium Futures and USDMXN and how we can combine the two to forecast the swings in Palladium and look for possible trading opportunities as well. We explain the long-term and mid-term Elliott wave view for Palladium and combine it with the cycles and sequences in USDMXN to forecast the most likely path going forward.
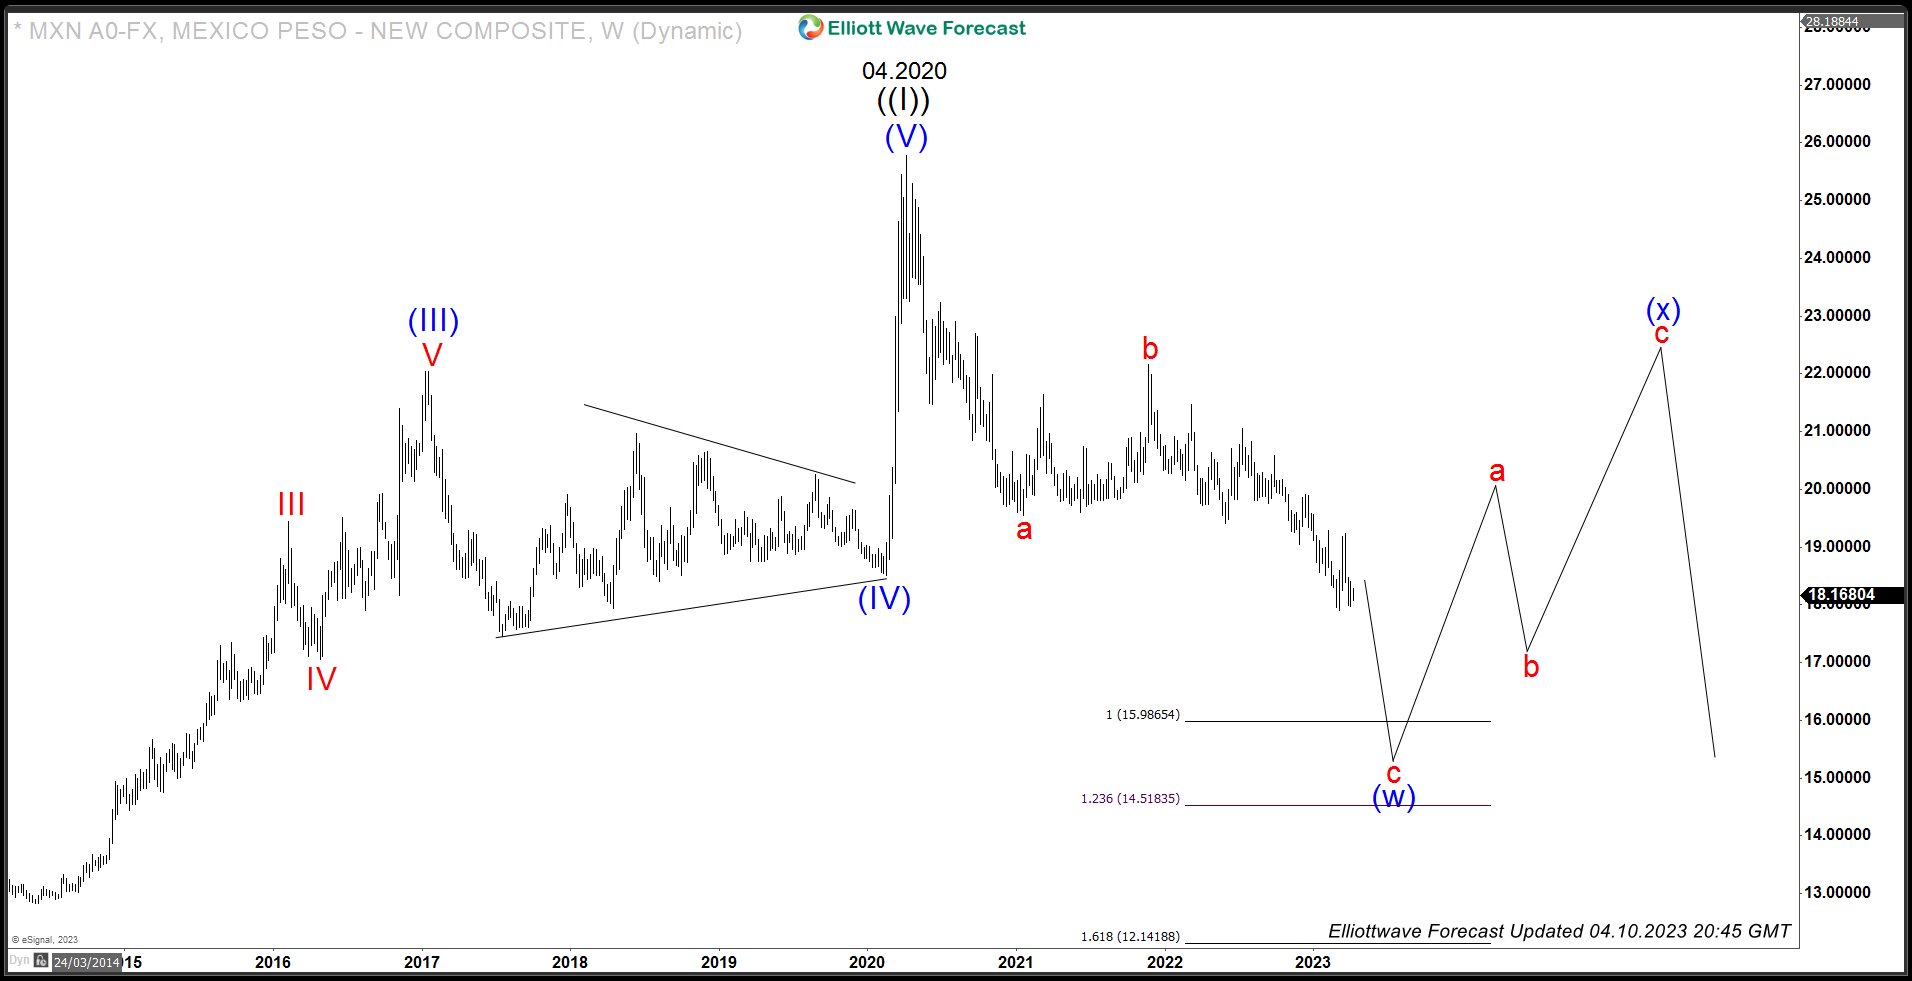
USDMXN Elliott Wave Analysis – April 10, 2023 Weekly Chart
Chart below shows USDMXN pair showing incomplete bearish sequence since April 2020 peak and it calls for more downside toward 15.986 – 14.518 to complete a zigzag Elliott wave structure down from 04.2020 peak and then we should expect a larger 3 waves bounce to correct the entire decline from 04.2020 peak or a 3 waves bounce to correct the cycle from 11.2021 peak at minimum.
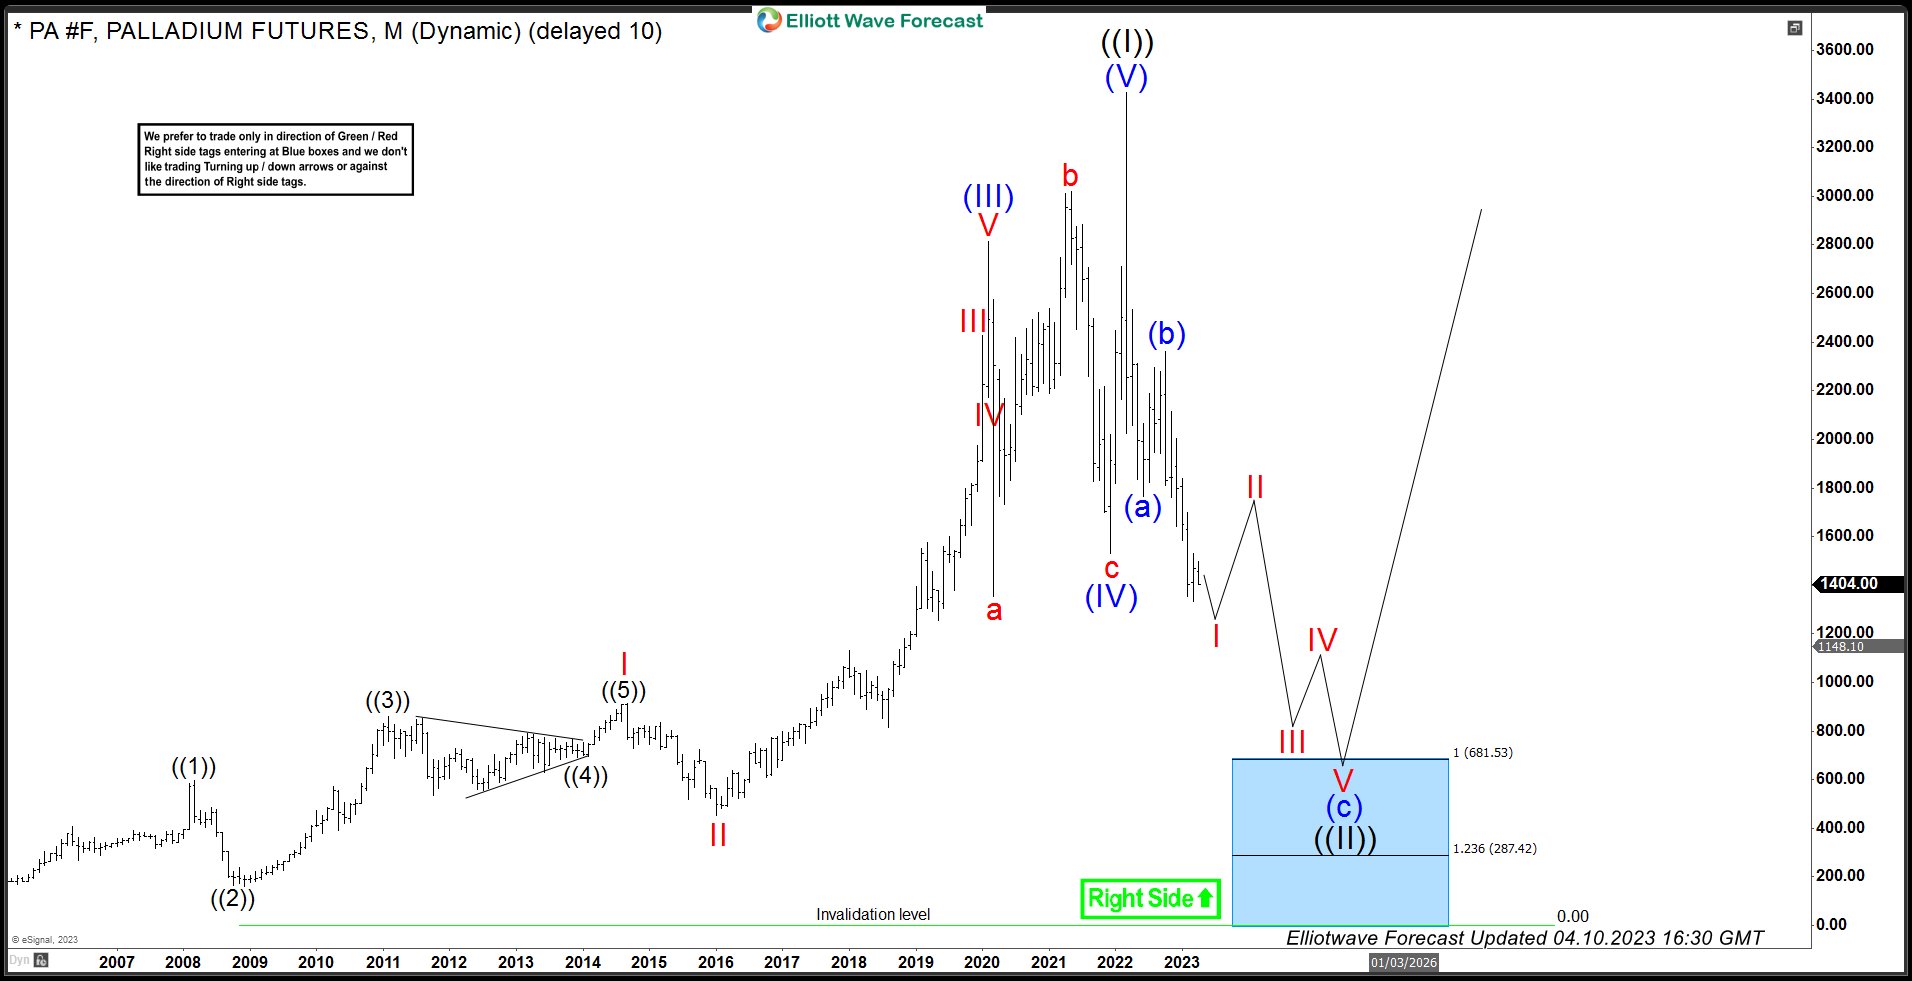
Palladium Futures Elliott Wave Analysis – April 10, 2023 Monthly Chart
Chart below is a monthly chart of Palladium futures and it is also showing an incomplete bearish sequence down from the all time peak (March 2022) with secondary peak coming at October 2022. While below this peak, it should see more downside toward 681.53 – 287.42 area and find buyers in the blue box area. Blue Boxes are High-Frequency areas which are based in a relationship of sequences, cycles and calculated using extensions. Our idea is that wave II of (c) in Palladium Futures should be USDMXN at 15.986 – 14.518 area and 3 waves bounce shown in USDMXN should be wave III, IV and V of (c) lower in Palladium.
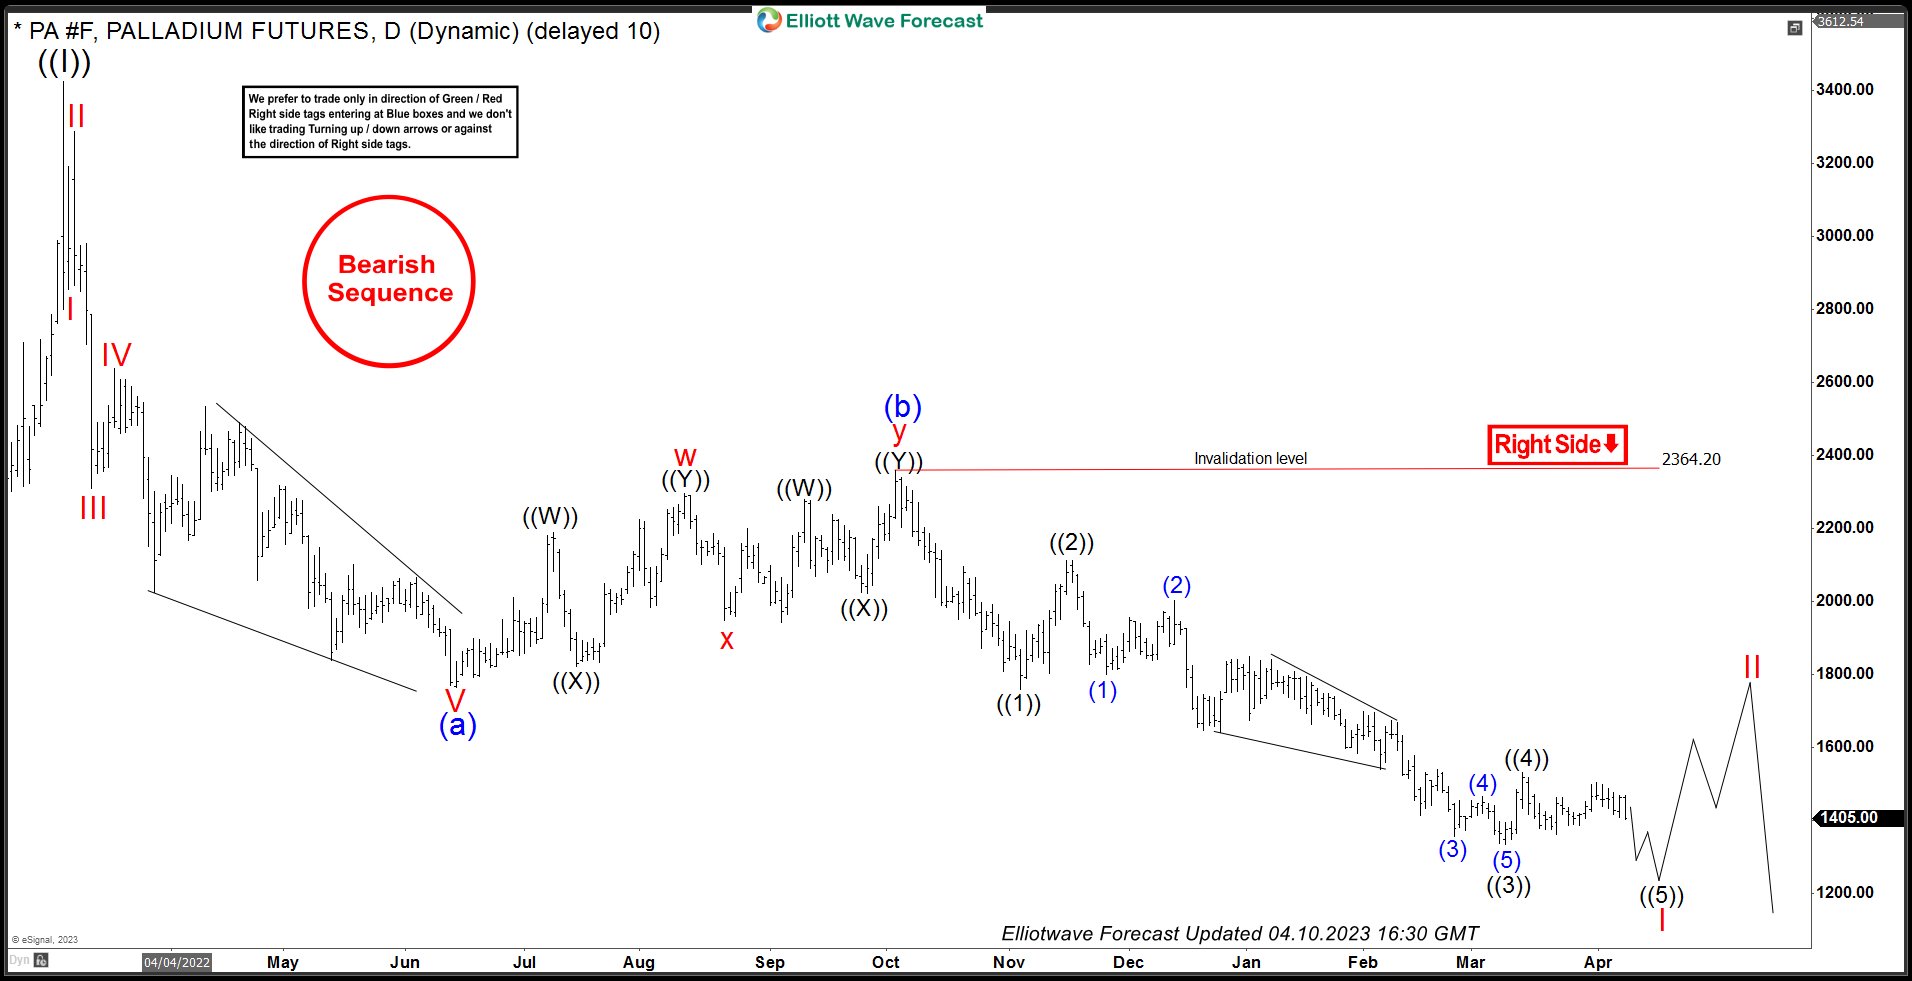
Palladium Futures Elliott Wave Analysis – April 10, 2023 Daily Chart
Chart below is the daily chart of Palladium which shows a zoomed in view of the decline since the peak at March 2022 and also from the secondary peak at 2364.20. We can already see 3 waves completed so one more low should make it a five waves impulsive decline and then a three waves bounce should follow at minimum which should see sellers appearing in three, seven or eleven swings for the next leg lower to complete the sequence.


