5 Wave Impulse + 7 Swing WXY correction

$GOOGL 1H Elliott Wave Chart 12.16.2025:
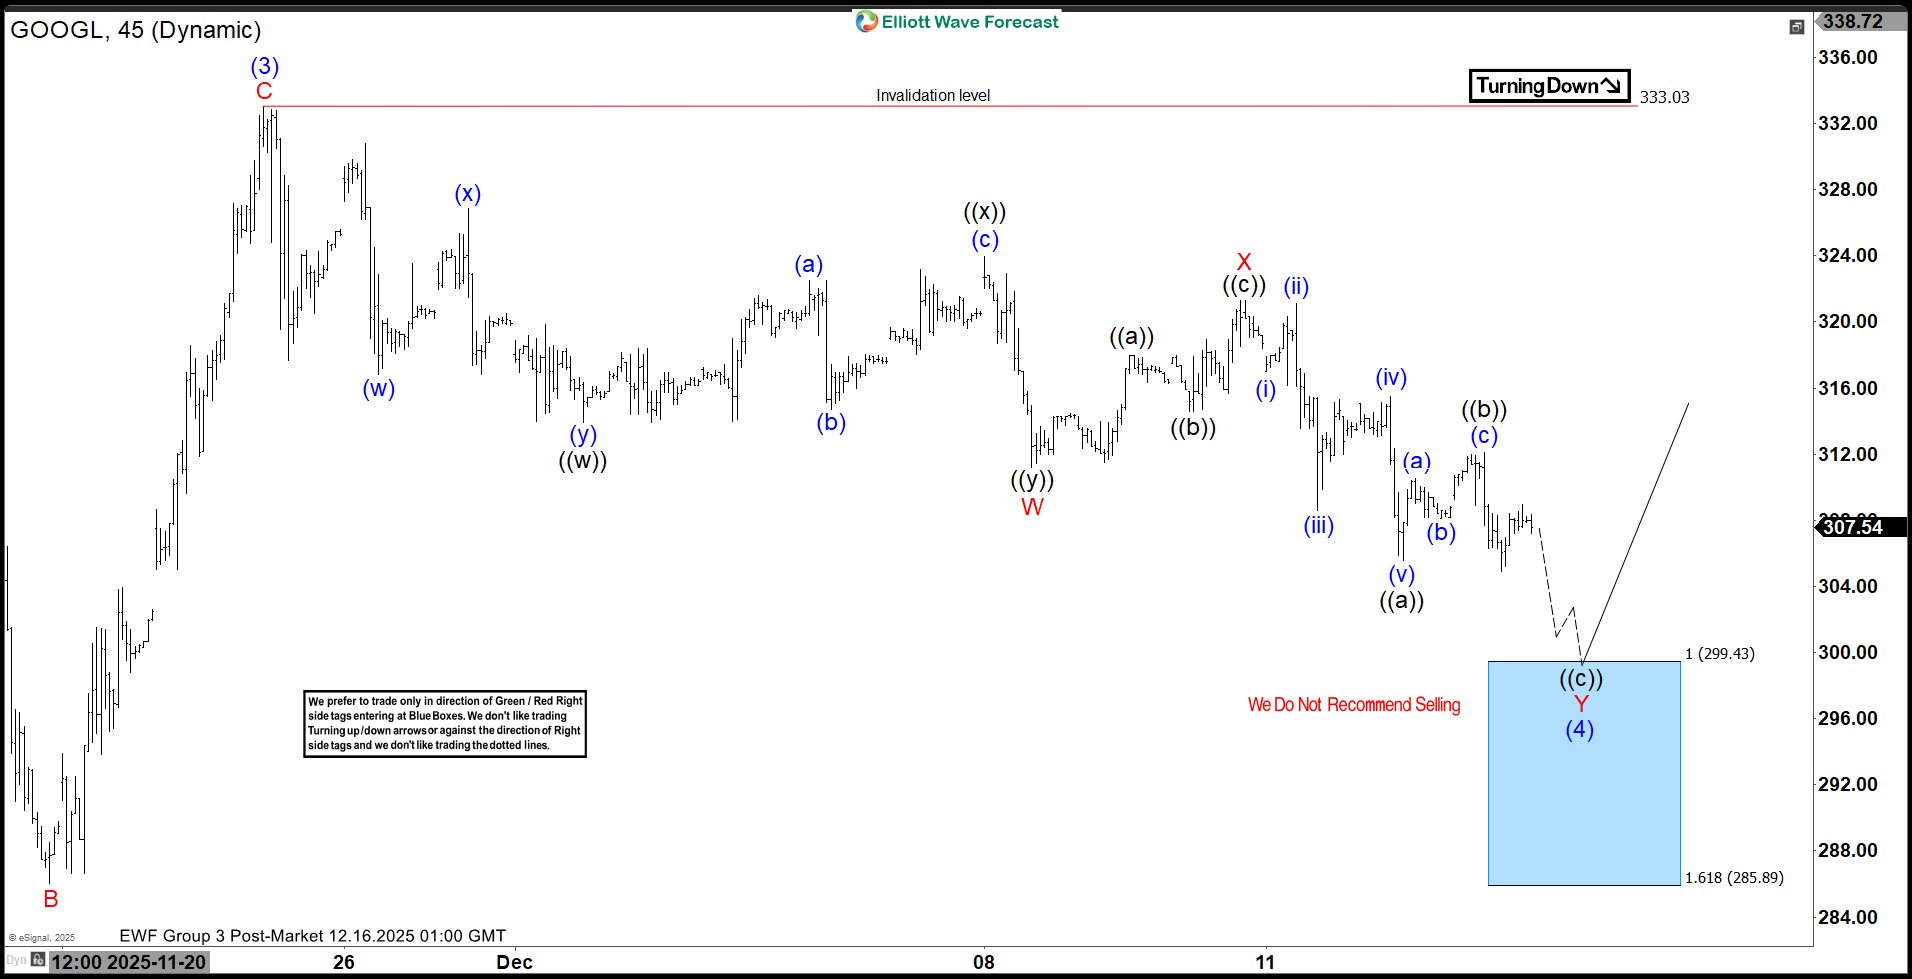 In the 1-hour Elliott Wave count from Dec 16, 2025, we saw that $GOOGL completed a 5-wave impulsive cycle at blue (3). As expected, this initial wave prompted a pullback. We anticipated this pullback to unfold in 7 swings, likely finding buyers in the equal legs area between $299.43 and $285.89.
This setup aligns with a typical Elliott Wave correction pattern (WXY), in which the market pauses briefly before resuming its primary trend.
$GOOGL 1H Elliott Wave Chart 12.28.2025:
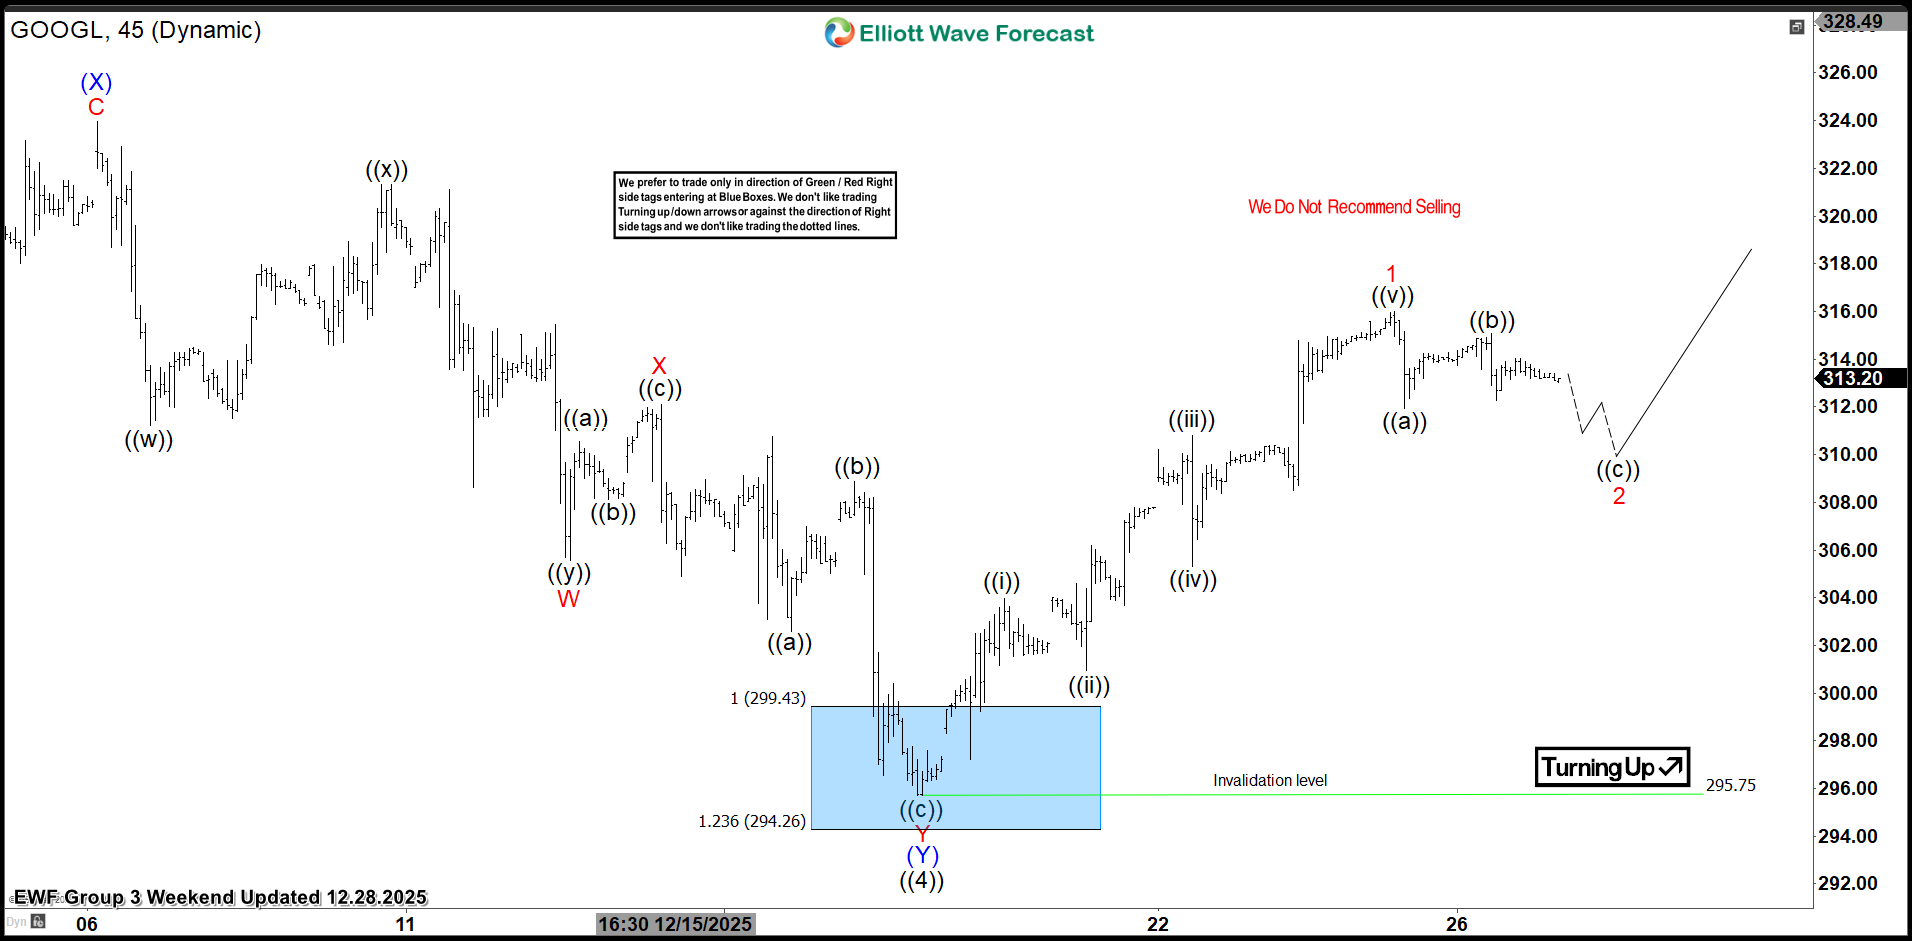
The latest update, from Dec 28, 2025, shows that the stock bounced as predicted. Currently, it is trading higher in wave 2 of (1) of ((5)) looking for continuation higher into all time highs towards 335 – 348 to finish 5 waves from the Dec 17th low and Apr 2025.
Conclusion
In conclusion, our Elliott Wave analysis of $GOOGL continues to prove accurate, suggesting that the stock remains well-supported against its December 2025 lows. For traders who capitalized on the entry opportunities presented in the “blue box” area, the $299 –$294 zone should be closely monitored as the next significant objective. In the interim, keeping a vigilant eye out for any healthy corrective pullbacks could present fresh entry opportunities for those looking to join the trend.
By applying the principles of Elliott Wave Theory, traders can gain a deeper understanding of market cycles, better anticipate the structure of upcoming moves, and ultimately enhance their risk management strategies in dynamic markets like the current one for $GOOGL.
By applying Elliott Wave Theory, traders can better anticipate the structure of upcoming moves and enhance risk management in volatile markets.
$GOOGL Elliott Wave Video Analysis
Elliott Wave Forecast
We cover 78 instruments, but not every chart is a trading recommendation. We present Official Trading Recommendations in the Live Trading Room. If not a member yet, Sign Up for 14 days Trial now and get access to new trading opportunities.
Welcome to Elliott Wave Forecast!
