The SPDR S&P Biotech ETF (XBI) is an exchange-traded fund that tracks the biotechnology segment of the S&P Total Market Index. This ETF allows investors to gain exposure to large, mid, and small-cap biotech stocks. If you’re interested in biotechnology, XBI could be worth exploring further. Here are some of its top holdings and their percentage weights: United Therapeutics Corporation (UTHR): 2.92%. Exact Sciences Corporation (EXAS): 2.91%. Gilead Sciences, Inc. (GILD): 2.89%. Sarepta Therapeutics, Inc. (SRPT): 2.87%. Amgen Inc. (AMGN): 2.84%. Alnylam Pharmaceuticals, Inc. (ALNY): 2.65%. Regeneron Pharmaceuticals, Inc. (REGN): 2.64%. Vertex Pharmaceuticals Incorporated (VRTX): 2.60%. AbbVie Inc. (ABBV): 2.60%. BioMarin Pharmaceutical Inc. (BMRN): 2.56%.
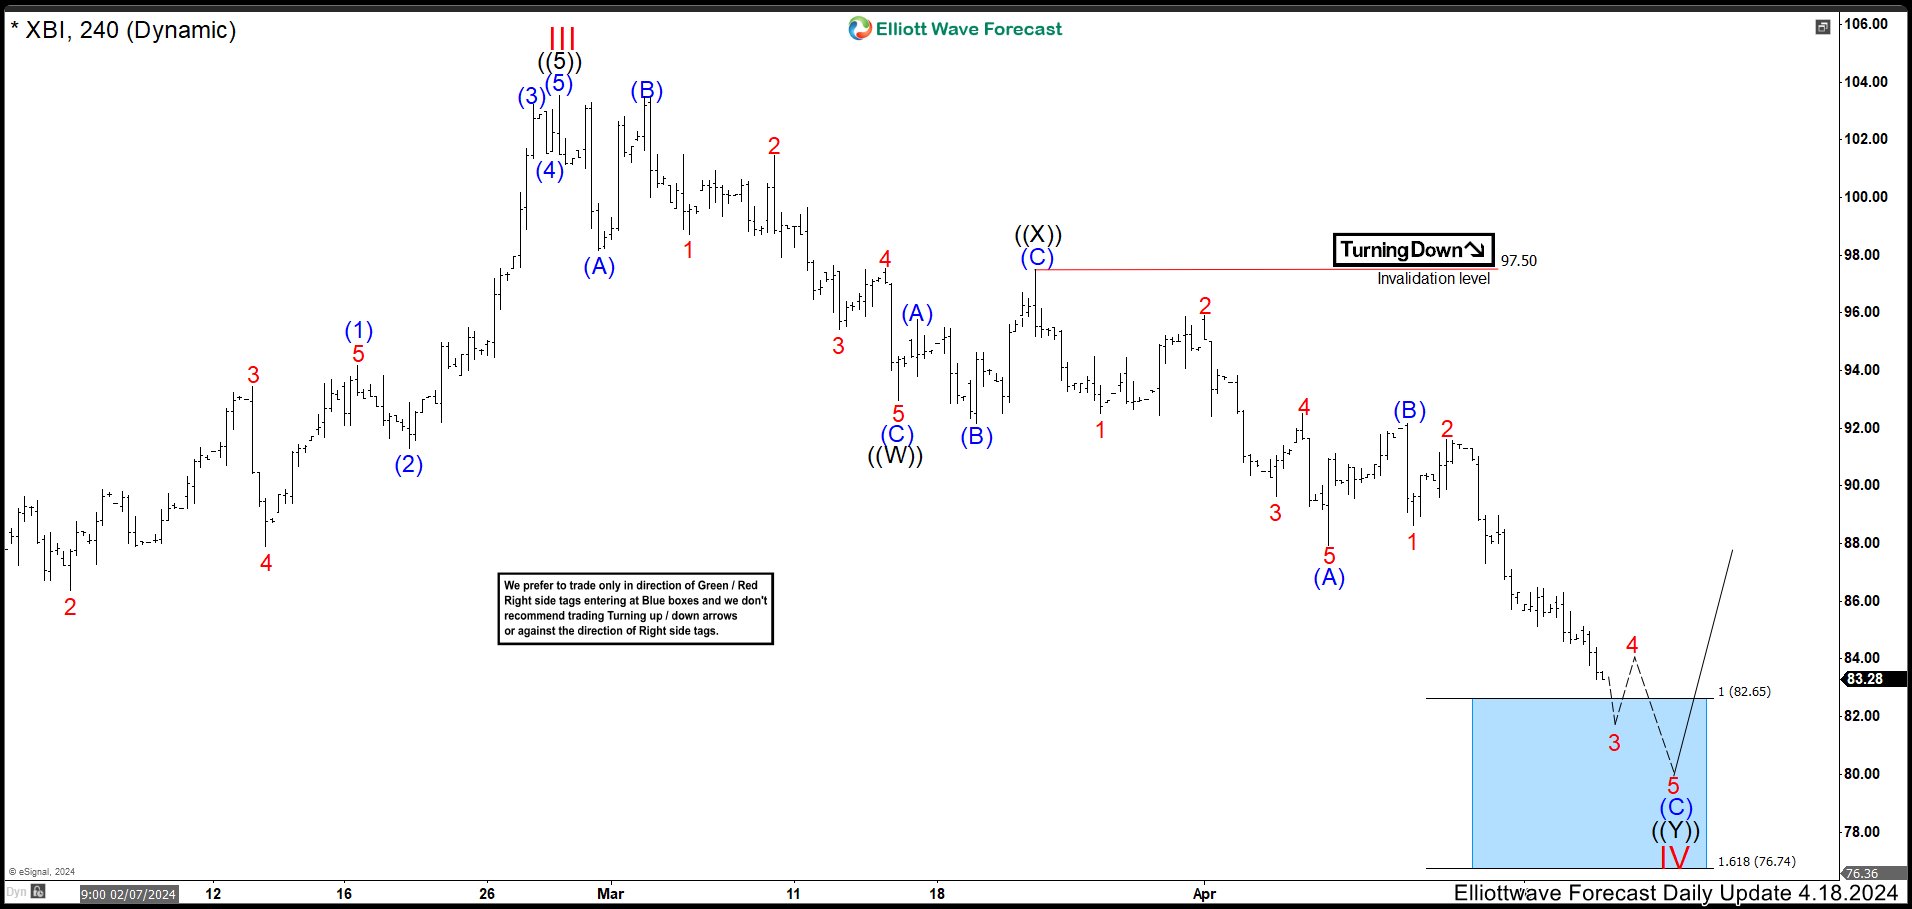
XBI 4 Hour Chart April 18th 2024
The chart above shows the 4-hour XBI picture of April. We can see that we called ended a cycle as wave III in the high of February. From here, the market began a pullback forming a double correction structure. We expected this cycle to end in the blue box area 82.65 – 76.74 and continue the bullish movement.
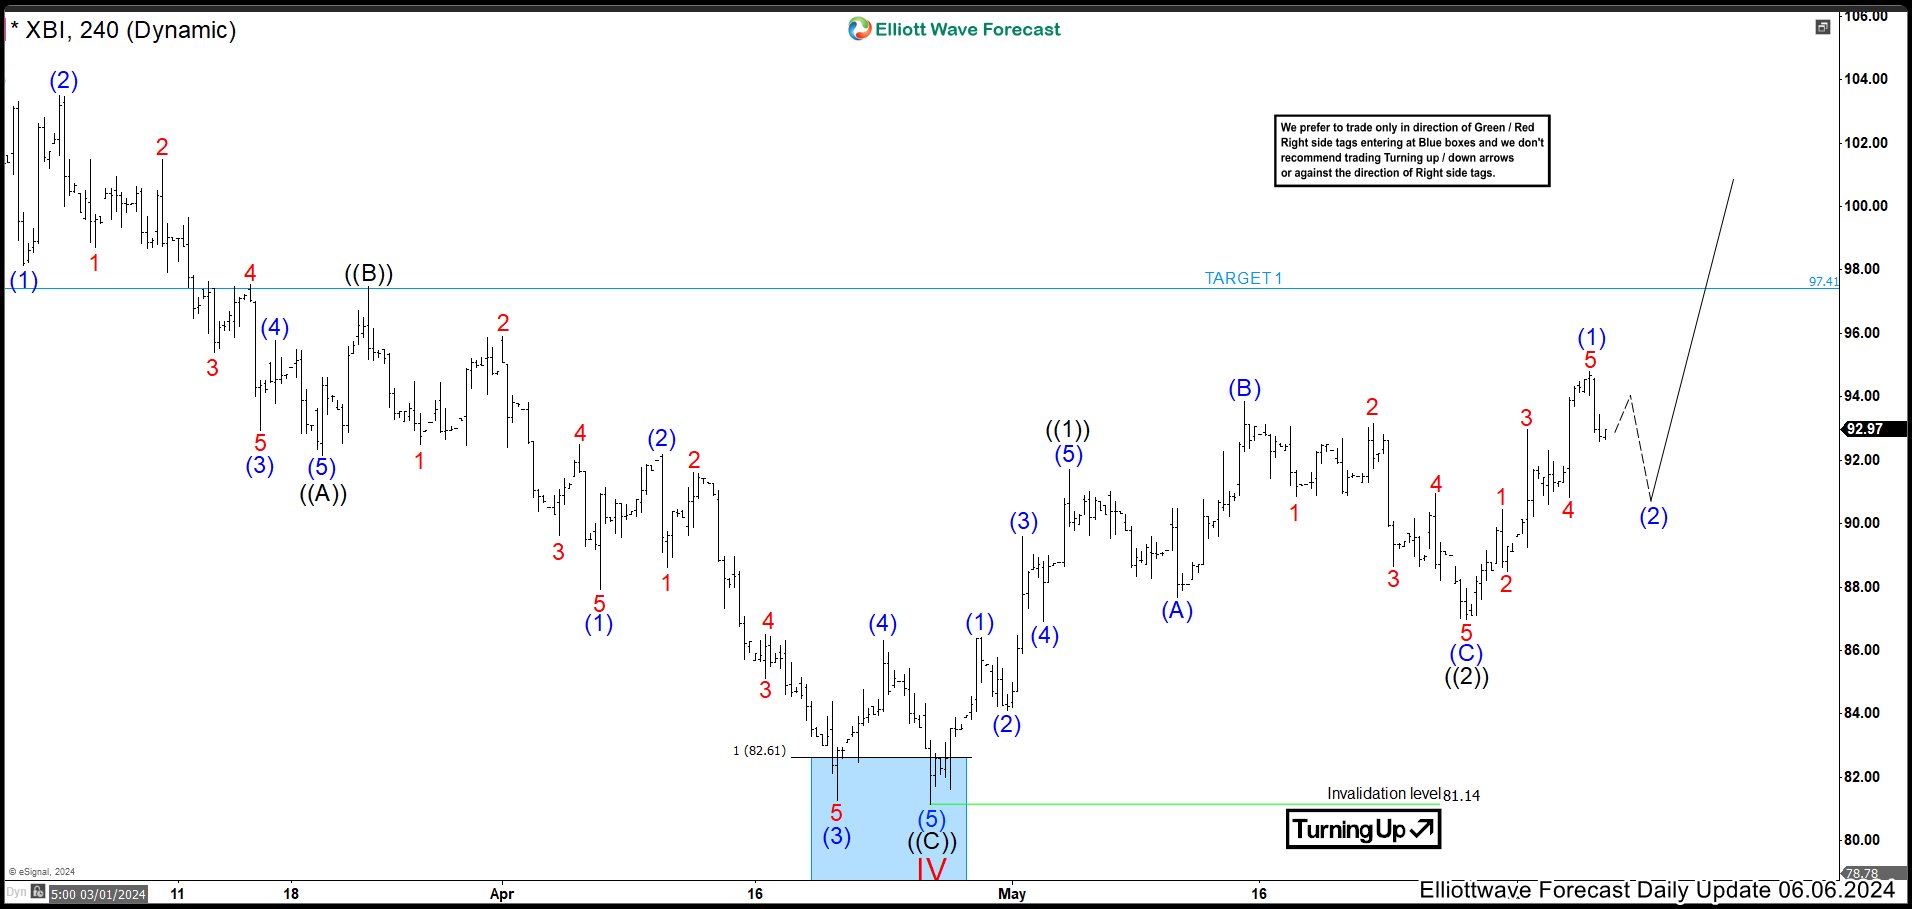
XBI 4 Hour Chart June 6th 2024
Market hit the blue box ended the wave IV correction at 81.14 low and continued the rally as expected. Then, XBI managed to build an impulse as wave ((1)) and wave ((2)) developed an expanded flat correction ending at 86.98 low. Here, we calculated the first target resulting at 97.41. Looking very probable as XBI continued the rally from wave ((2)) low. (If you want to learn more about Elliott Wave Theory, follow these links: Elliott Wave Education and Elliott Wave Theory).
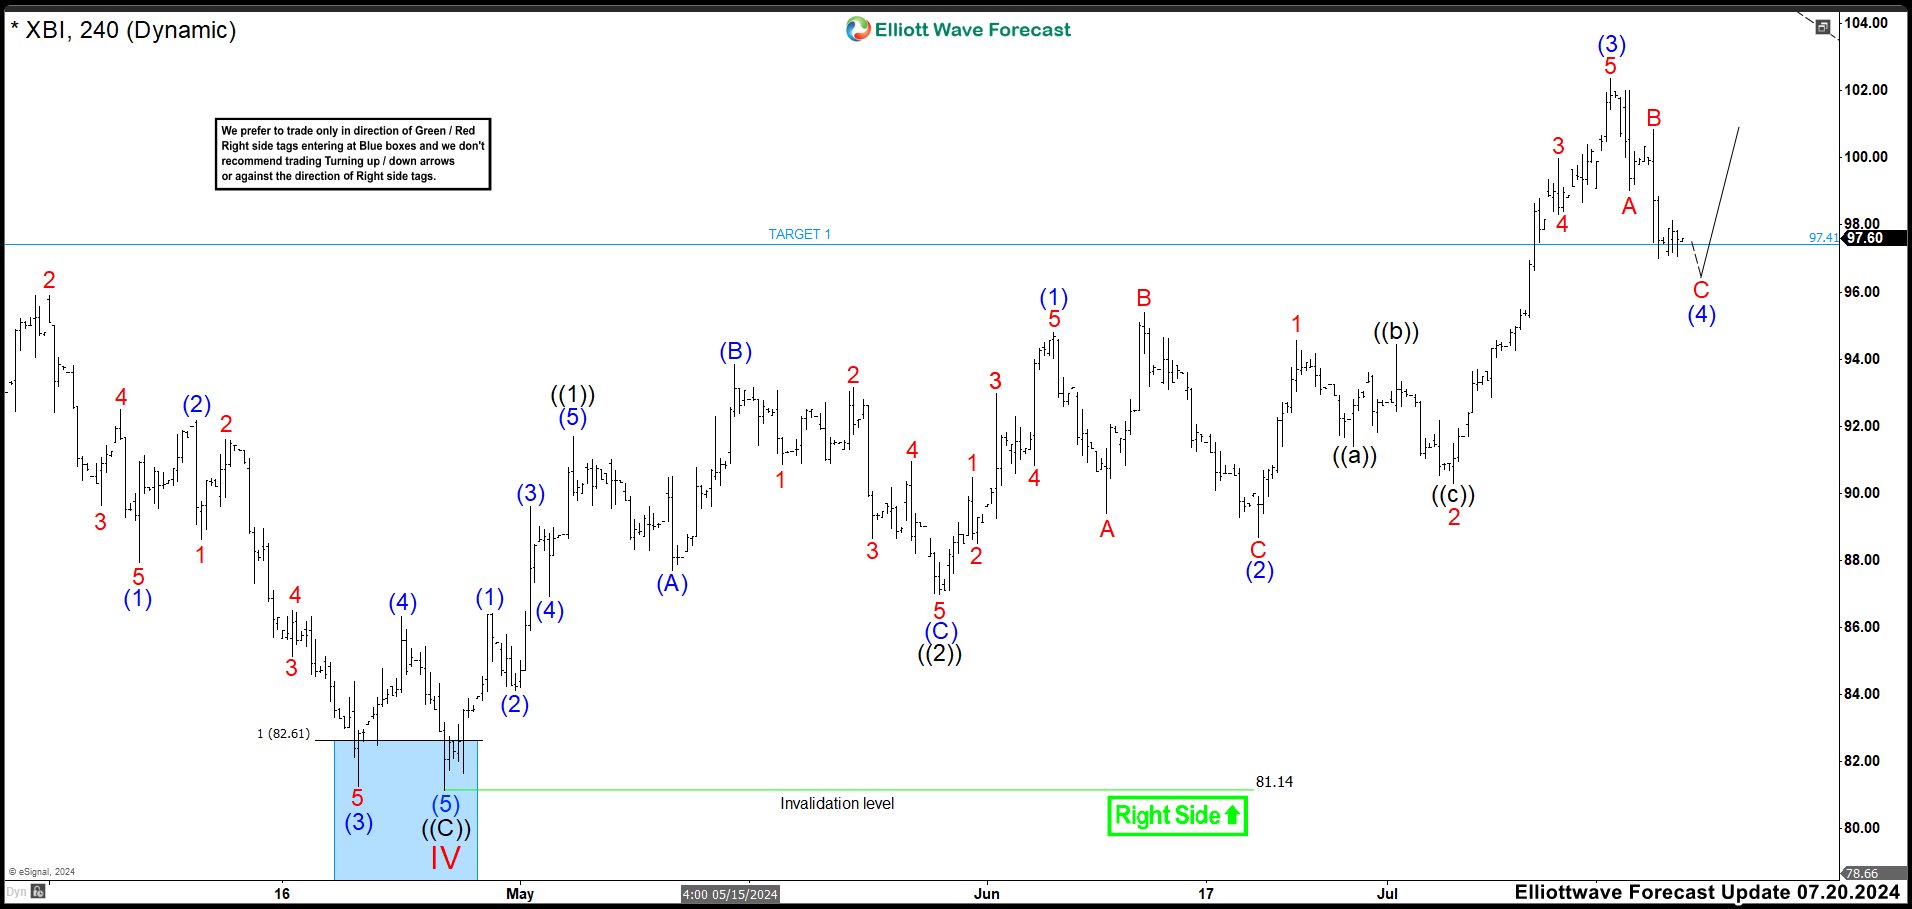
XBI 4 Hour Chart July 20th 2024
After sideways movement in the whole month of June, the market resumed to the upside again. The target 1 was hit generating aroung 18% of profits. Currently, we are still looking for more upside to complete a wave V. The structure is trading in wave (4) of ((3)) of V, suggesting that XBI has more way to run. If you want to trade XBI, the next target comes around 108.85. This view is valid as price action does not break below 94.80 and in worst case 88.69 low.
Elliott Wave Forecast
www.elliottwave-forecast.com updates one-hour charts 4 times a day and 4-hour charts once a day for all our 78 instruments. We do a daily live session where we guide our clients on the right side of the market. In addition, we have a 24 hours chat room where we will help you with any questions about the market.
14 Days Trial costs $9.99 only. Cancel anytime at support@elliottwave-forecast.com
Back


