IWM barely breached the November 2021 high before a significant pullback followed. However, the larger bullish cycle should resume in the coming weeks while current pullback ends above 161.69 pivot point. Where should buyers look for the next opportunity?
The iShares Russell 2000 ETF (IWM) is one of the most widely traded exchange-traded funds (ETFs) that tracks the performance of the Russell 2000 Index. This index represents the smallest 2,000 companies in the broader Russell 3000 Index, focusing on small-cap U.S. companies
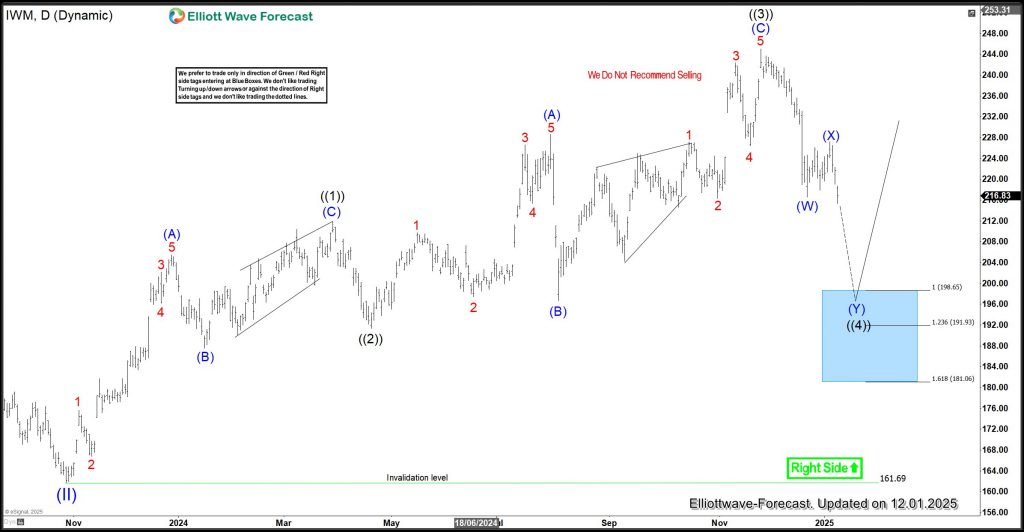
IWM is bullish on both the weekly and daily charts against the March 2020 and October 2023 lows respectively. Despite the current pullback from the November 2024 high, the ETF remains in a clear bullish trend. Before this pullback, prices completed a corrective cycle in October 2023 after a 5-wave bullish sequence that spanned March 2020 to November 2021. The bullish move from October 2023 is forming a 5-wave sequence that should surpass the November 2021 high. While the 3rd wave of this sequence broke above the November 2021 peak, the 5-wave structure is not yet complete. Thus, the current pullback from the November 2024 high likely represents wave ((4)).
In long-term bullish trends like this, pullbacks often present favorable buying opportunities. In contrast, during bearish trends, sellers target the extremes of rallies. Buyers should wait for wave ((4)) to reach its extreme before entering long positions. The pullback from the November 2024 high appears incomplete. Where will wave ((4)) find its bottom and invite new bids?
IWM Daily Chart Updated on 12.01.2024
As the daily chart above shows, IWM is evolving lower with a double zigzag (7-swing) structure. Wave (W) of ((4)) ended on 20.12.2024, followed by wave (X) on 06.01.2025. Although wave (X) appears shallow, the break below the wave (W) low confirms that wave (Y) is in progress. Wave (X) acts as the connector within the double zigzag. As long as the 227.17 level (wave (X) high) remains intact, wave (Y) should continue lower toward the 198.65–181.06 Fibonacci extreme. At this zone, wave ((4)) is expected to complete, and wave ((5)) should begin. Buyers will likely focus on this area for new opportunities.
Why can’t we sell now?
Of course, you may be wondering, “Why not sell now?” While we expect the dip in wave (Y) to reach the extreme area, the probability of this playing out exactly as forecast is less than 50%. Price could take an alternative path and complete the pullback at a different extreme. However, if the dip does extend as expected, there is at least a 70% chance that a 3-swing bounce will occur at the projected extreme area.
This high probability is supported by two key reasons:
- The bullish overall trend: Institutional buyers often take advantage of dips in a bullish market to buy low and sell high, just as they sell into bounces in a bearish market to maximize profits.
- Historical patterns in pullbacks: More than 70% of the time, 3- or 7-swing pullbacks/bounces in bullish or bearish sequences react strongly near the equal leg zone (100-138.2%).
We will closely monitor IWM’s price action for Elliottwave-Forecast members in the coming days across all time frames. When a buy setup emerges, we ensure our members don’t miss the opportunity.
About Elliott Wave Forecast
At www.elliottwave-forecast.com, we update one-hour charts four times daily and four-hour charts once daily for all 78 instruments. We also conduct daily live sessions to guide clients on the right side of the market. Additionally, we have a chat room where moderators answer market-related questions. Experience our service with a 14-day trial for only $9.99. Cancel anytime by contacting us at support@elliottwave-forecast.com.
Back

