Energy Fuels is the largest US miner of the uranium. It produces the uranium both in form of triuranium octoxide and uranium hexafluoride. Besides the core business, the secondary products of Energy Fuels are rare earth elements and vanadium. Founded in 2006, the company has its headquarters in Lakewood, Colorado. One can trade it under the ticker $UUUU at the New York Stock Exchange. Investors in shares of the mining company are participating, therefore, in the company success story on the one hand and in the price development of the uranium commodity on the other.
Currently, we see the ongoing price appreciation within the energy commodities like oil, gas, coal and others. Consequently, uranium is expected to turn higher after 13 years of weak prices as well. Besides the market correlation in the energy group, the pattern of $UUUU on its own demonstrates an impulsive bullish behavior. Therefore, investors in the energy sector obtain a good diversification opportunity by investing in the largest uranium mining company of US.
Energy Fuels Weekly Elliott Wave Analysis 03.21.2021
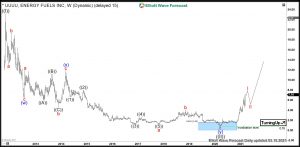
The weekly chart below shows the Energy Fuels shares $UUUU traded at NYSE. First, the stock price has developed a cycle higher in black wave ((I)) of grand super cycle degree. It has printed the all-time highs on October 2011 at 23.13. From the highs, a correction lower in black wave ((II)) has unfolded as an Elliott wave double three pattern. It has printed an important bottom on March 2020 at 0.78.
From March 2020 lows, a new cycle in wave ((III)) has already started and should extend towards 23.13 highs and beyond. Then, the target for wave ((III)) will be towards 23.96-38.28 area and even higher.
Energy Fuels Daily Elliott Wave Analysis 03.21.2021
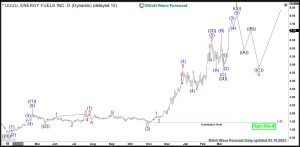
The Daily chart below shows the $UUUU shares price action in more detail. The stock can be in the early stages of the blue wave (I) of the black wave ((III)). Right now, the cycle higher from March 2020 in red wave I of blue wave (I) is still in progress. From the lows at 0.78, the stock price has advanced in the black wave ((1)). Then, after pullback in wave ((2)), an extension higher in black wave ((3)) has ended at 6.45. It has reached more than 2.618 multiples of the length of the wave ((1)). Therefore, it classifies the wave I as an ongoing impulse. Now, while above 03.05.2021 lows, where wave ((4)) has found its bottom, a final move higher in wave ((5)) should end the cycle higher in red wave I.
Currently, it can be risky chasing the March 2020 cycle higher. However, investors and traders can be looking to buy a clear pullback in 3, 7, 11 swings in wave II against 0.78 lows for another rally in wave III.
Get more insights about Stocks and ETFs by trying out our services 14 days . You’ll learn how to trade the market in the right side using the 3, 7 or 11 swings sequence. You will get access to our 78 instruments updated in 4 different time frames, Live Trading & Analysis Session done by our Expert Analysts every day, 24-hour chat room support and much more.
Back


