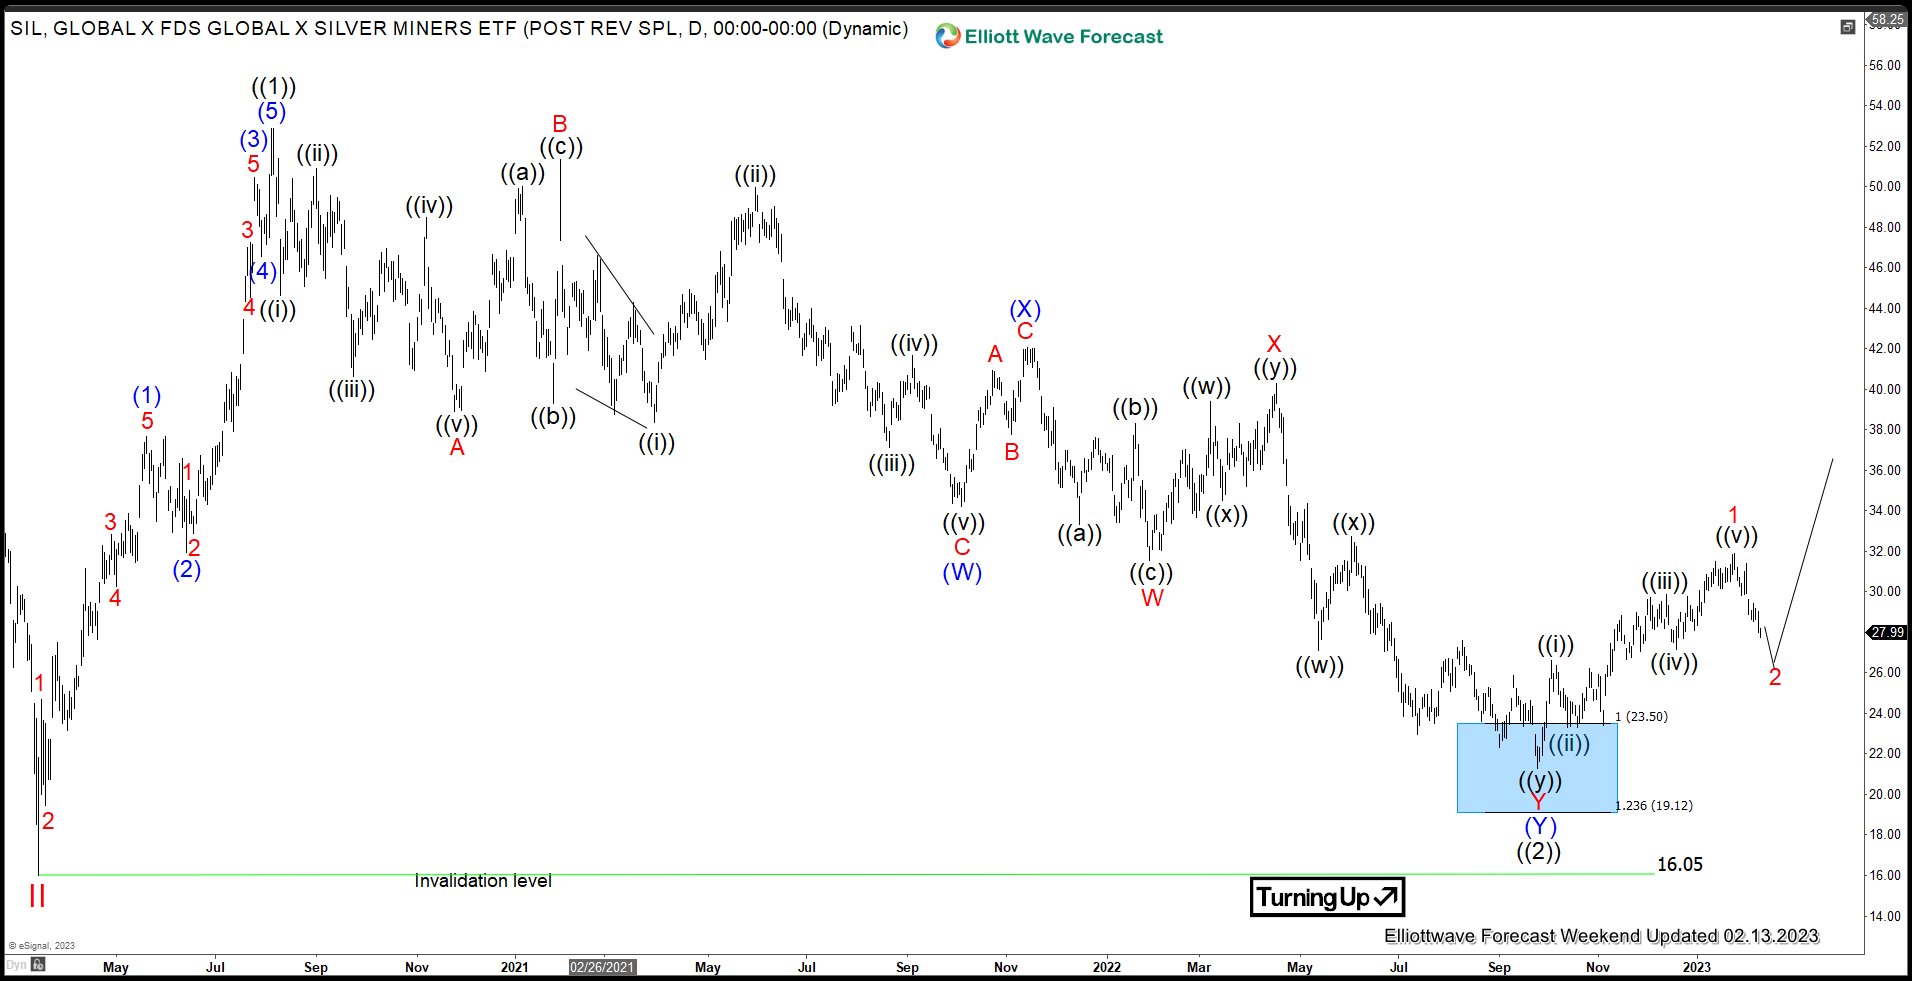
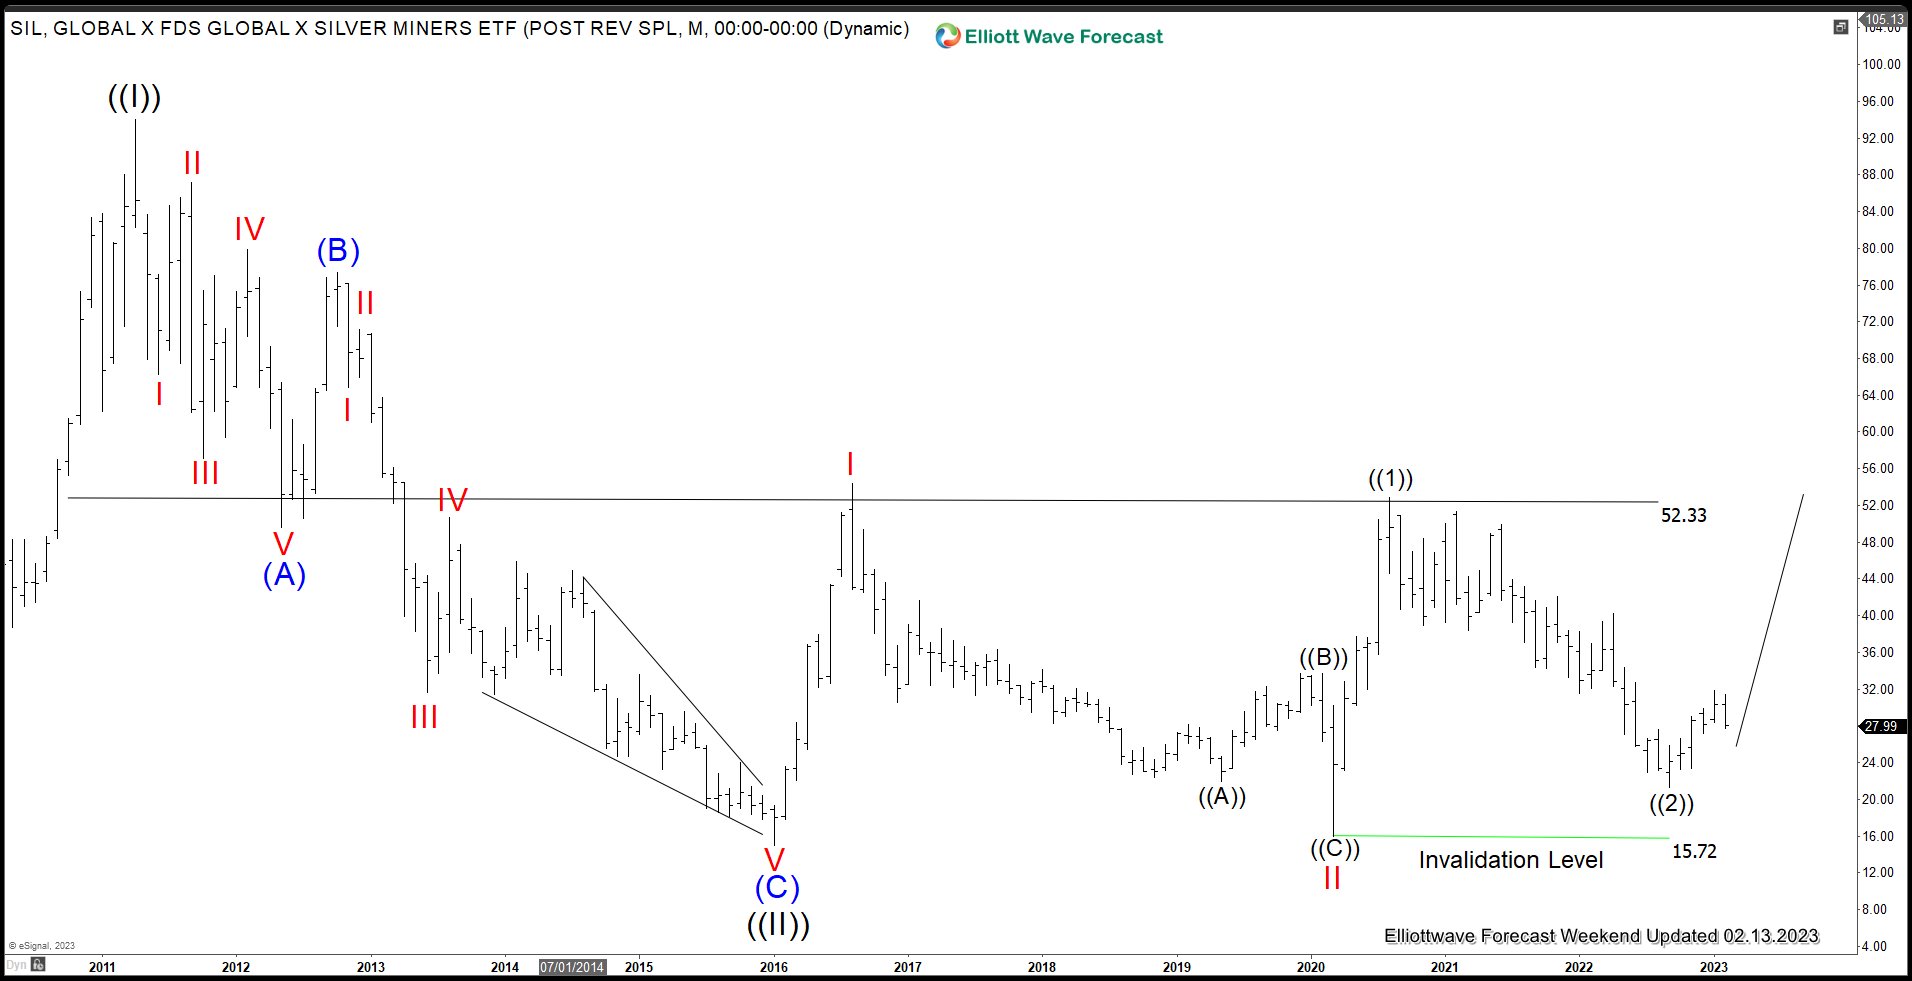
Silver Miners ETF (SIL) has ended the correction to the cycle from March 2020 low on Sept 26, 2022 low at 21.26. It has started to rally the next leg higher. However, it formed intermediate high on January 26 at 31.9. It ‘s now pulling back to correct cycle from Sept 26 low in larger degree 3, 7, or 11 swing. We will take a look at the Monthly and Daily Elliott Wave count below to see what we can anticipate in the near term and long term.
SIL (Silver Miners ETF) Monthly Elliott Wave Chart
Monthly Elliott Wave chart of SIL suggests that the ETF has ended wave ((II)) at 14.94 in 2016. From there, it rallies in a series of I-II-((1))-((2)) which is a nest structure. Up from wave ((II)), wave I ended at 54.34 and pullback in wave II ended at 15.72. It rallies again in wave ((1)) towards 52.87 and dips in wave ((2)) ended at 21.26. As far as SIL stays above 15.72, expect the ETF to extend higher again.
IL (Silver Miners ETF) Daily Elliott Wave Chart
 Daily SIL (Silver Miners ETF) Chart above suggests the ETF has ended wave ((2)) at 21.26. This is at the 100% – 161.8% Fibonacci extension of (W)-(X) from 8.5.2020 high. It has started to turn higher from the blue box area and ended wave 1 at 31.90. Pullback in wave 2 is now in progress to correct cycle from 9.26.2022 low in 3, 7, or 11 swing before the rally resumes. As far as dips stay above 21.26, and more importantly above 16.05, expect the ETF to extend higher.
SIL is not part of our regular service, but we cover Silver, Gold, and other commodities, ETF, Indices, Stock, and Forex. If you’d like to learn more about Elliott Wave or get regular updates, feel free to check our service and take trial here –> 14 days Trial
Back

