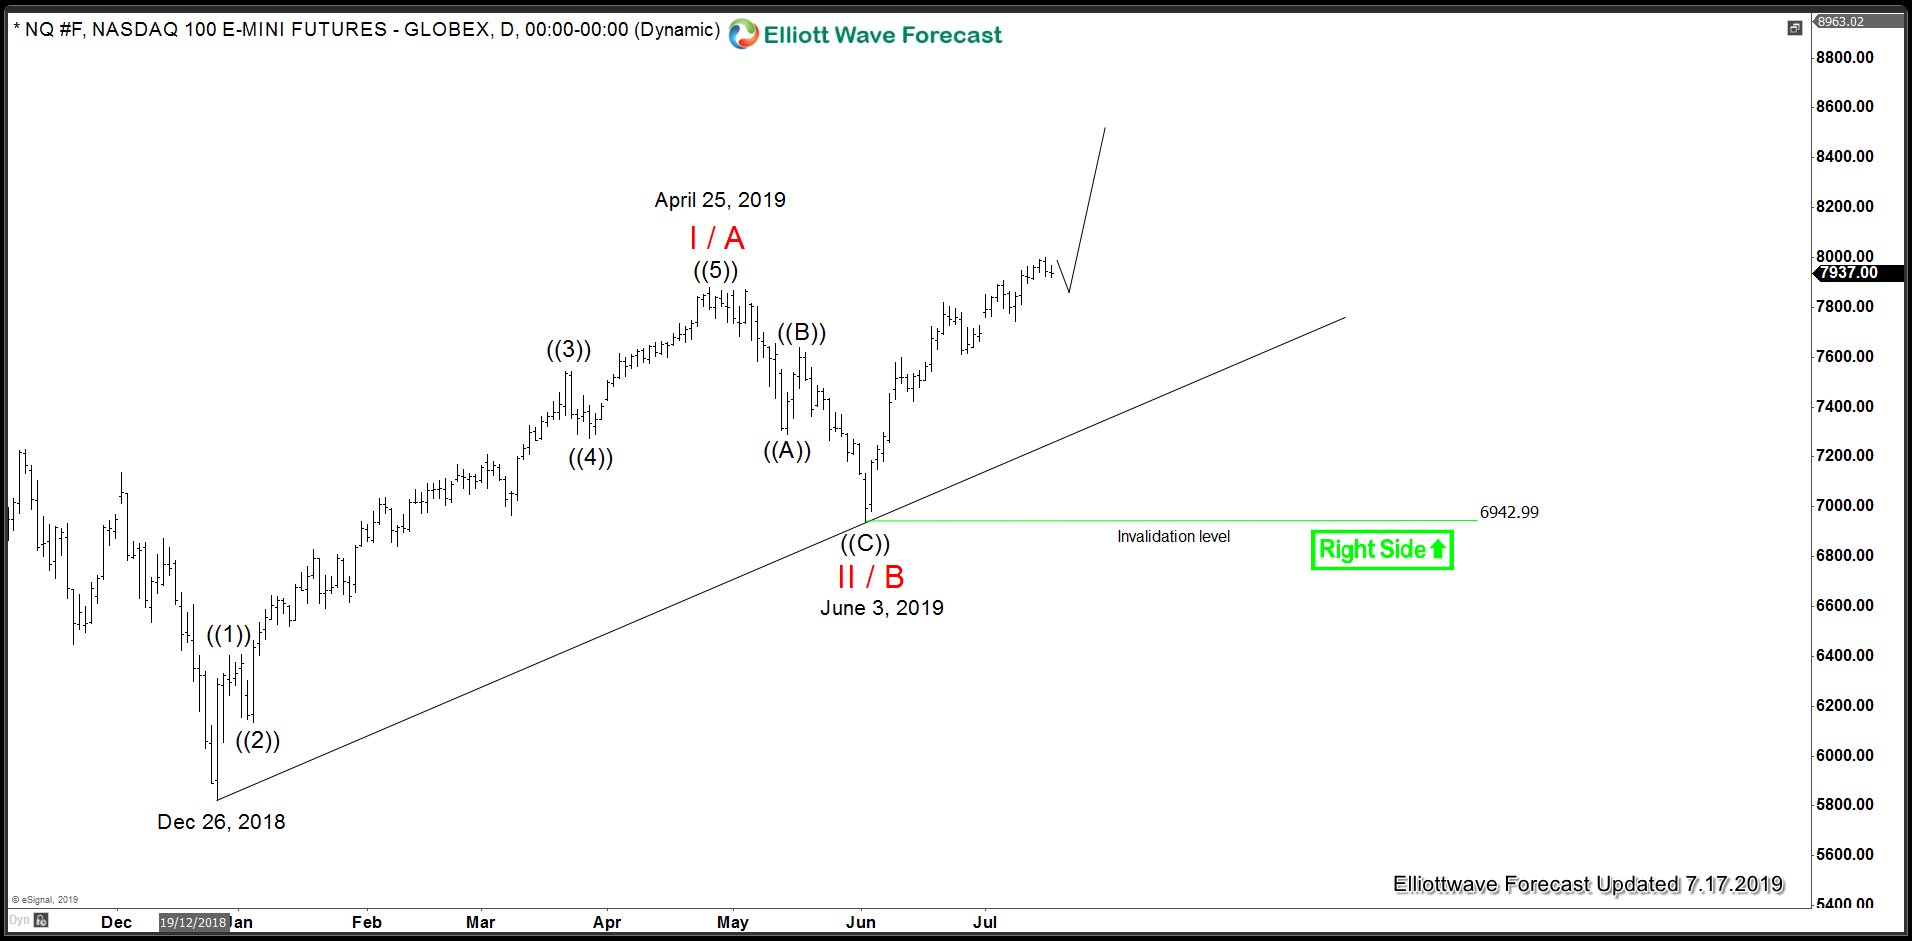
NQ_F (Nasdaq Futures) has gained around 15% since it’s early June low and has gained 37% since it’s December 2018 low. It has been creating higher highs and higher lows and has also broken above October 2018 peak to create new all time highs. In this blog, we will look at the cycle from December 26, 2018 low and explain what it means for the Index and highlight the targets and invalidation levels. Let’s take a look at the chart below which covers the rally from December 26, 2018 low.
NQ_F (Nasdaq Futures) Cycle December 26, 2018 Low
Chart above shows a sequence of higher highs and higher lows since December 26, 2018 low. Initial rally from December 26, 2018 low to April 25, 2019 peak was in 5 waves and pull back to June 3, 2019 low was a clear 3 waves move. Nasdaq Futures have since then rallied to a new high above April 25, 2019 peak and this break makes the sequence from December 26, 2018 low bullish and incomplete against June 3, 2019 low.
Based on this incomplete bullish Elliott Wave sequence, as far as pull backs hold above June 3, 2019 low, NQ_F (Nasdaq Futures) should extend the rally. Pull back could either correct the rally from June 13 low or June 3 low but as far as June 3 low remains in place, we should see extension higher. Only if the pivot at June 3, 2019 low gives up in the distribution system, we could see a retest or a break of June 3, 2019 low in the form of a FLAT correction down from April 25, 2019 peak. As far as June 3, 2019 low remains in place, next logical target to the upside would be 9015 – 9503 from where we could see another larger 3 waves pull back to correct the cycle from June 3, 2019 low at least.
Back


