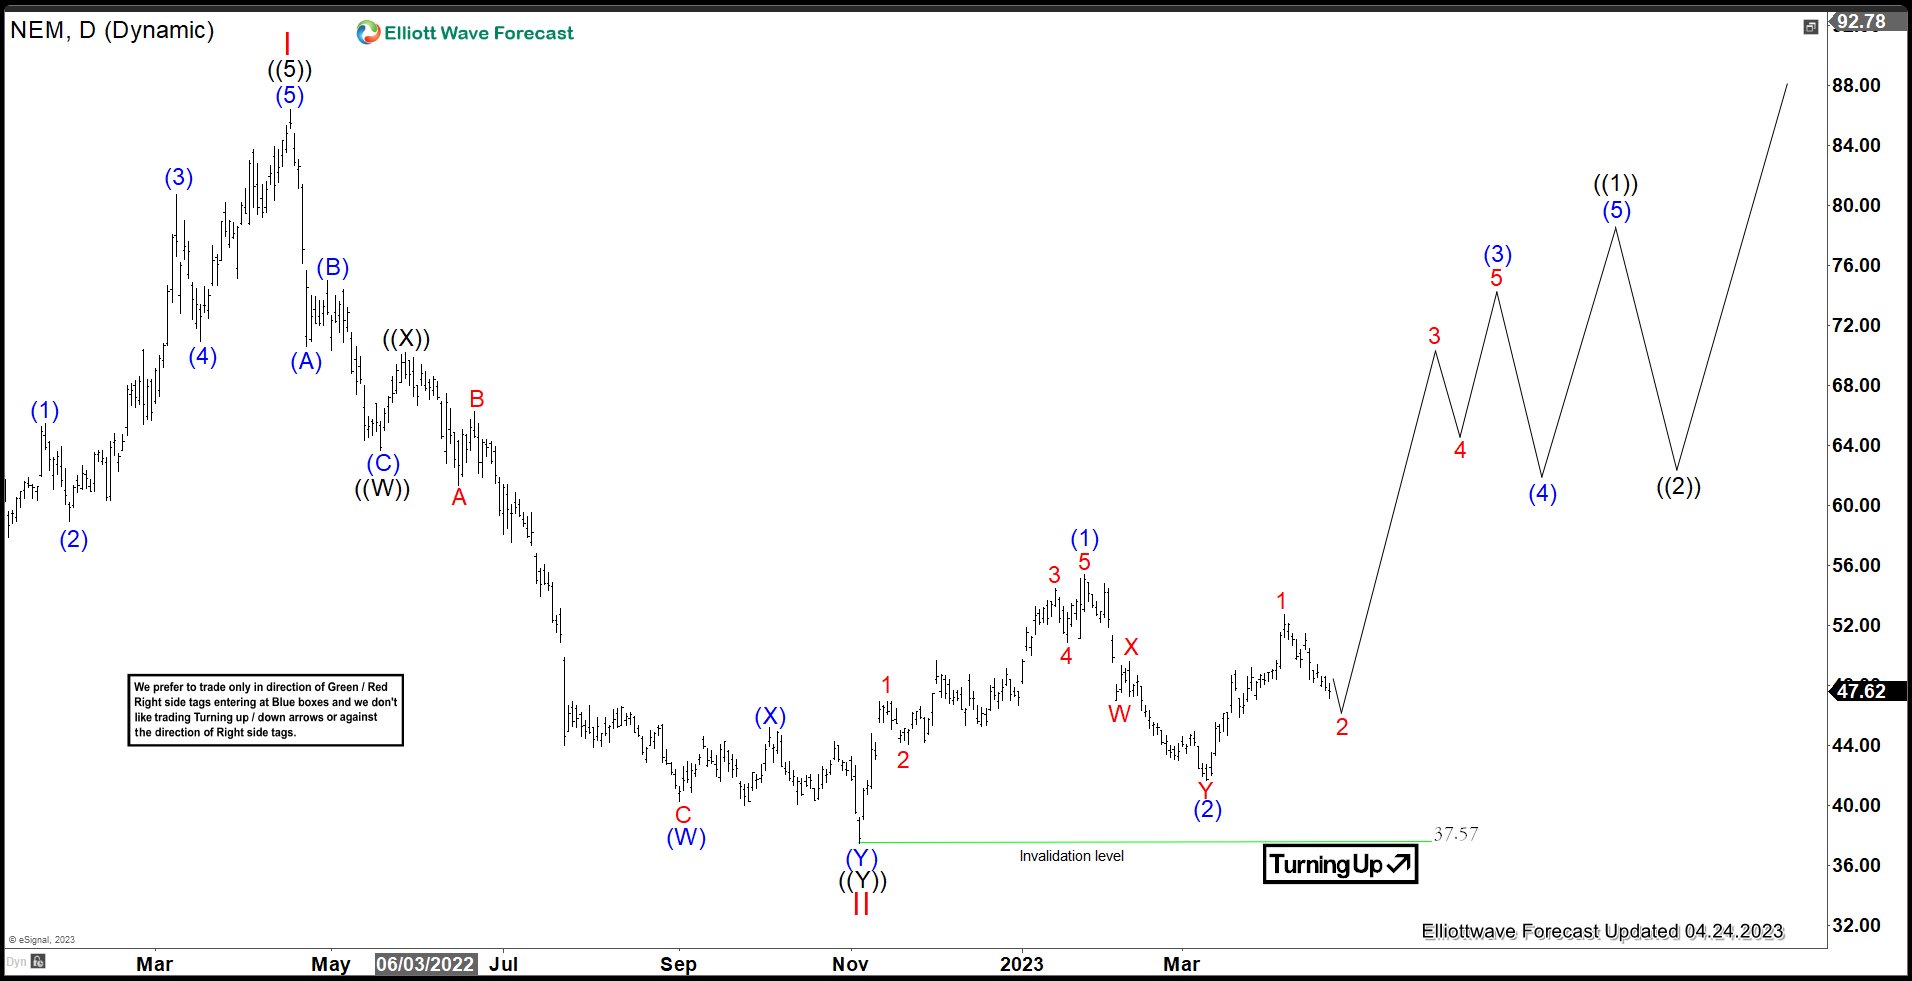
Newmont Mining (ticker: NEM) is the world’s largest gold mining company, based in Greenwood Village, Colorado, United States. The stock may have formed a significant low at 37.57 on November 2022 and started a new bullish cycle. This article looks at the Elliott Wave Outlook for the stock.
Newmont Monthly Elliott Wave Chart
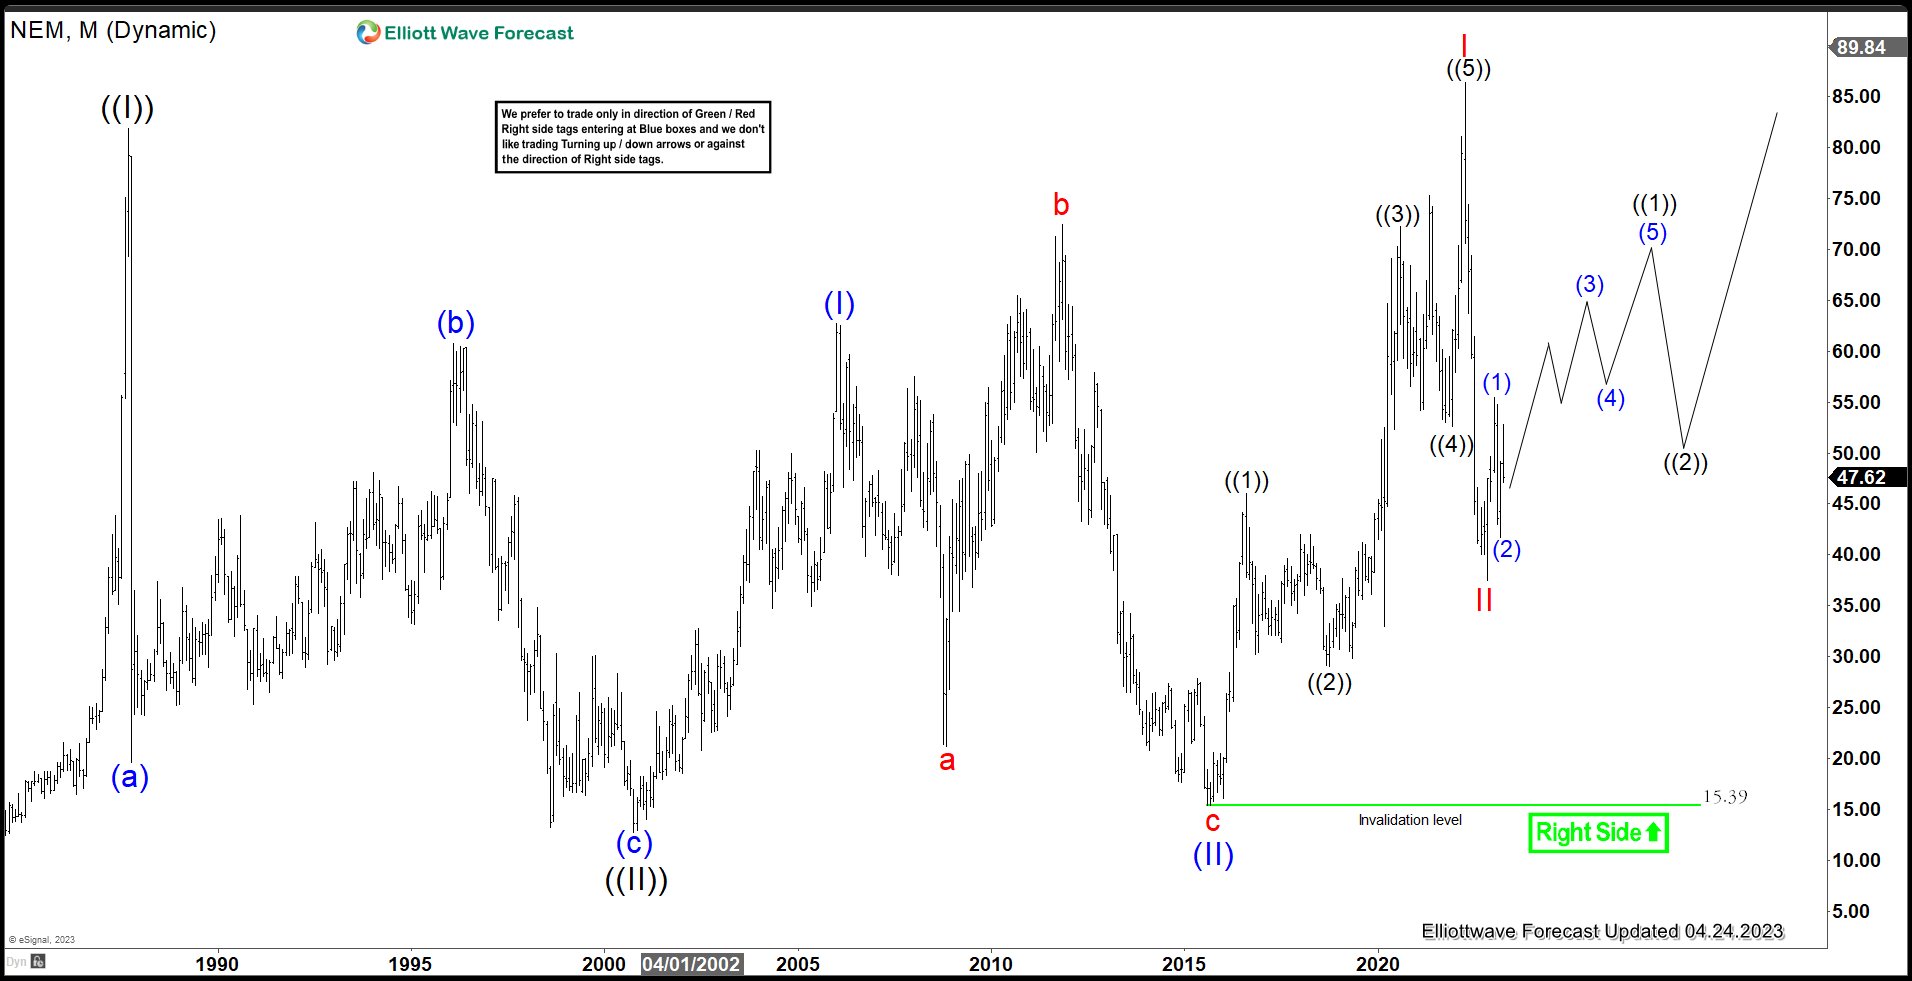
Monthly Elliott Wave Chart in Newmont Mining (NEM) above shows a bullish sequence as it broke above the previous peak wave ((I)) on September 1987 at 81.92. Wave ((II)) pullback has ended in 3 swing at 12.75 and stock resumes higher in a new impulsive structure within wave ((III)). Up from wave ((II)), wave (I) ended at 62.72 and pullback in wave (II) ended at 15.39. Then stock rallied higher in wave I of (III) at 86.37 and wave II of (III) ended at 37.45. Expect the stock to extend higher while pivot at 15.39 low remains intact.
Newmont Daily Elliott Wave Chart
Daily Elliott Wave for Newmont Mining (NEM) above shows that the stock ended wave II pullback at 37.57. It has turned higher in wave III. Up from wave II, wave (1) ended at 55.41 and dips in wave (2) ended at 41.68. As far as pivot at 37.57 low stays intact, expect the stock to extend higher.
NEM is not part of our regular service. However, we cover related instrument such as Gold, GDX, and XME. If you’d like to get regular updates on stocks, ETF, Indices, Forex, and commodities, feel free to take our Trial here –> 14 Days Trial


